Essential MLB Insights Delivered Daily
The Ballpark Pal Research Feed, in partnership with DubClub, offers direct access to over 20 detailed reports each morning to prepare you for the upcoming MLB slate. Delivered straight to your phone or inbox, these reports include park factors, simulation results, pitching previews, matchup ratings, DFS projections, outlier odds, and much more. Examples of all 23 reports are included below. Subscribe through DubClub now to receive the feed in your inbox tomorrow morning!
- Page 1: Daily Stadium Report
- Page 2: Pitching Preview #1 (Physics)
- Page 3: Pitching Preview #2 (Contact)
- Page 4: Pitching Preview #3 (Projections)
- Page 5: Home Run Report #1
- Page 6: Home Run Report #2
- Page 7: Batter vs Pitcher Matchups
- Page 8: Game Sims Report #1 (Sides)
- Page 9: Game Sims Report #2 (Totals)
- Page 10: Daily Fantasy Report
- Page 11: Most Likely Report
- Page 12: Outlier Odds Report
- Page 13: MLB's Hottest Players
- Page 14: MLB's Coldest Players
- Page 15: MLB's Luckiest Players
- Page 16: MLB's Unluckiest Players
- Page 17: Bullpen Rankings
- Page 18: Batting Lineup Rankings
- Page 19: Rotation Rankings
- Page 20: Team Rankings
- Page 21: Hitter Rankings
- Page 22: Starter Rankings
- Page 23: Reliever Rankings
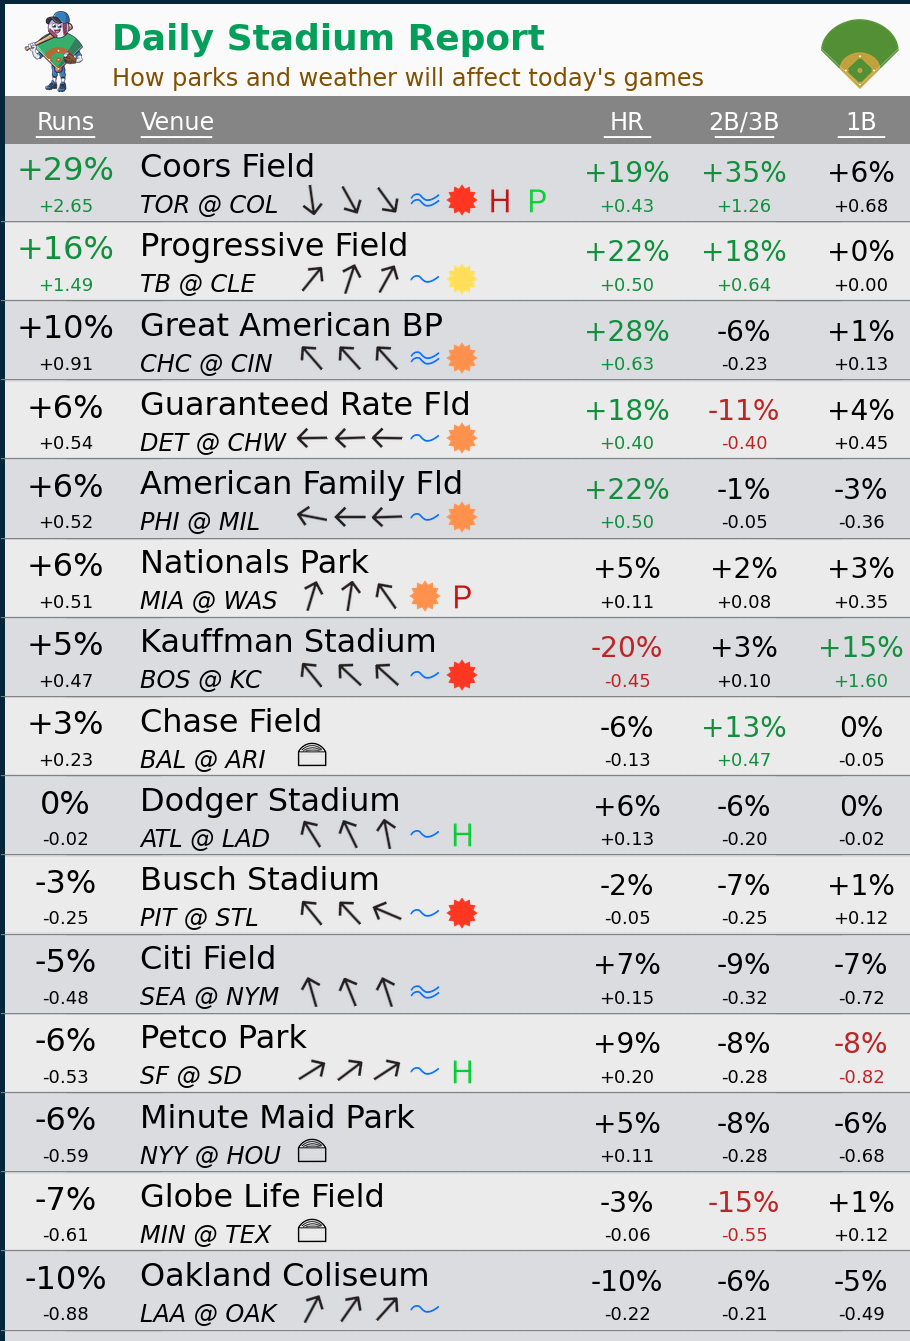
Page 1: Daily Stadium Report
This report provides model estimates for how park factors will impact each game on the slate (details of our methodology are here). These numbers represent the combination of park and weather (not just weather). Wind affects each park differently, which this model does take into account. For example, the open-air nature of Wrigley Field is highly sensitive to the speed and direction of the wind on a given day. Parks with tall stadium walls like Milwaukee and Toronto are barely affected by wind, even if it's blowing hard. Percentages and +/- numbers are relative to the MLB average. For example, Coors Field in the example below expects a 29% boost in runs, which equals about 2.65 runs more than league average.
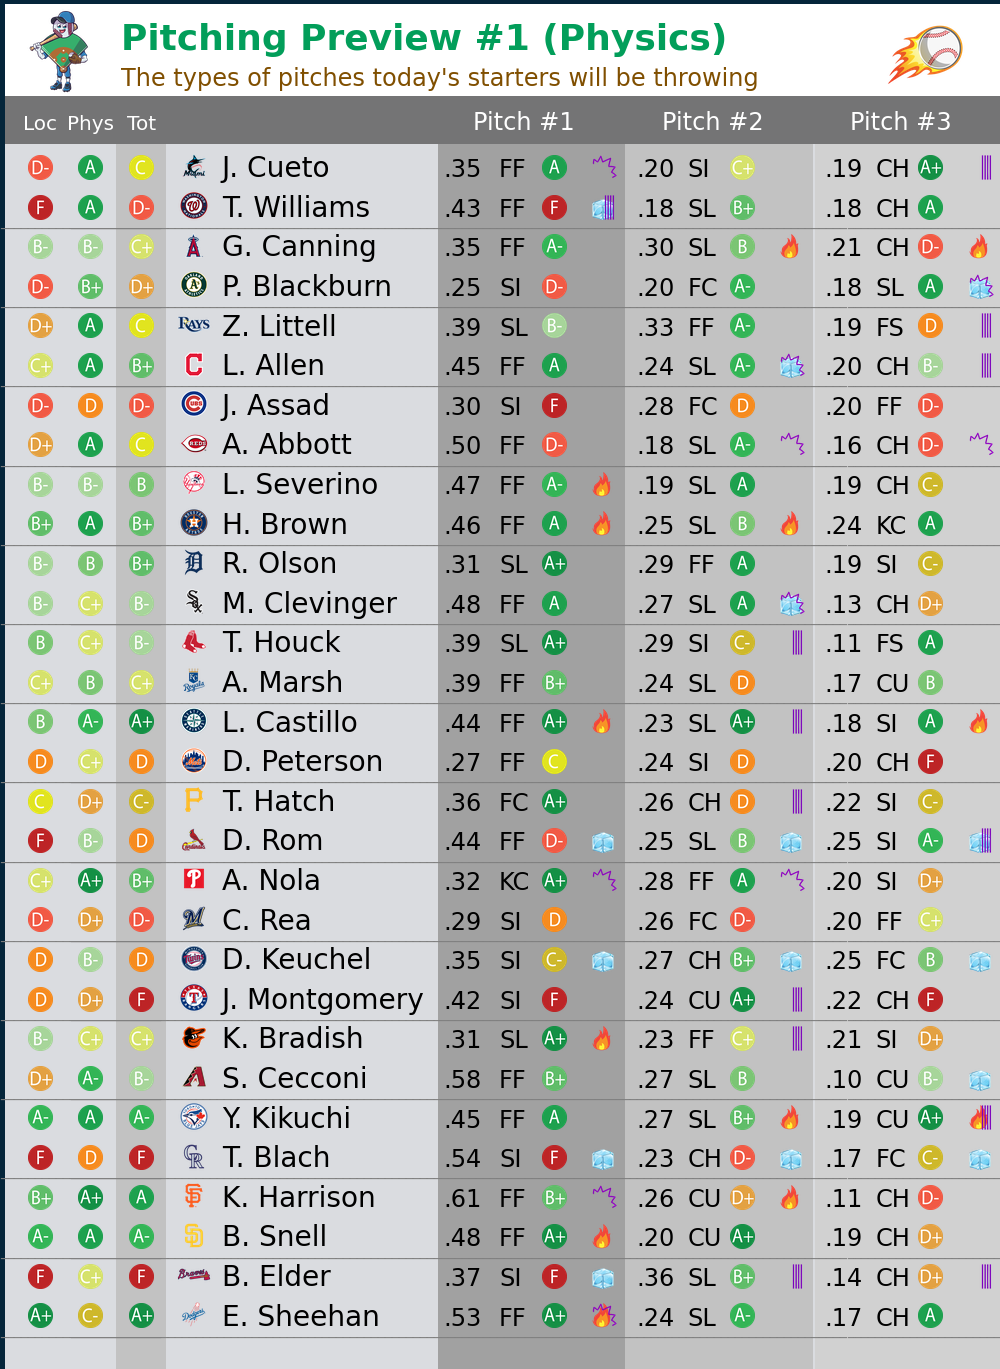
Page 2: Pitching Preview #1 (Physics)
This report focuses on the quality of pitches thrown by each pitcher on today's slate. It uses the Pitch Expectation Model, which assigns expected outcomes to each pitch according to its physical characteristics. There is more to pitching than how the ball travels through the air, and it's common for pitchers to over and underperform their pitch quality. However, this sort of analysis helps provide a baseline for a pitcher's physical abilities and is often more predictive than recent outcomes.

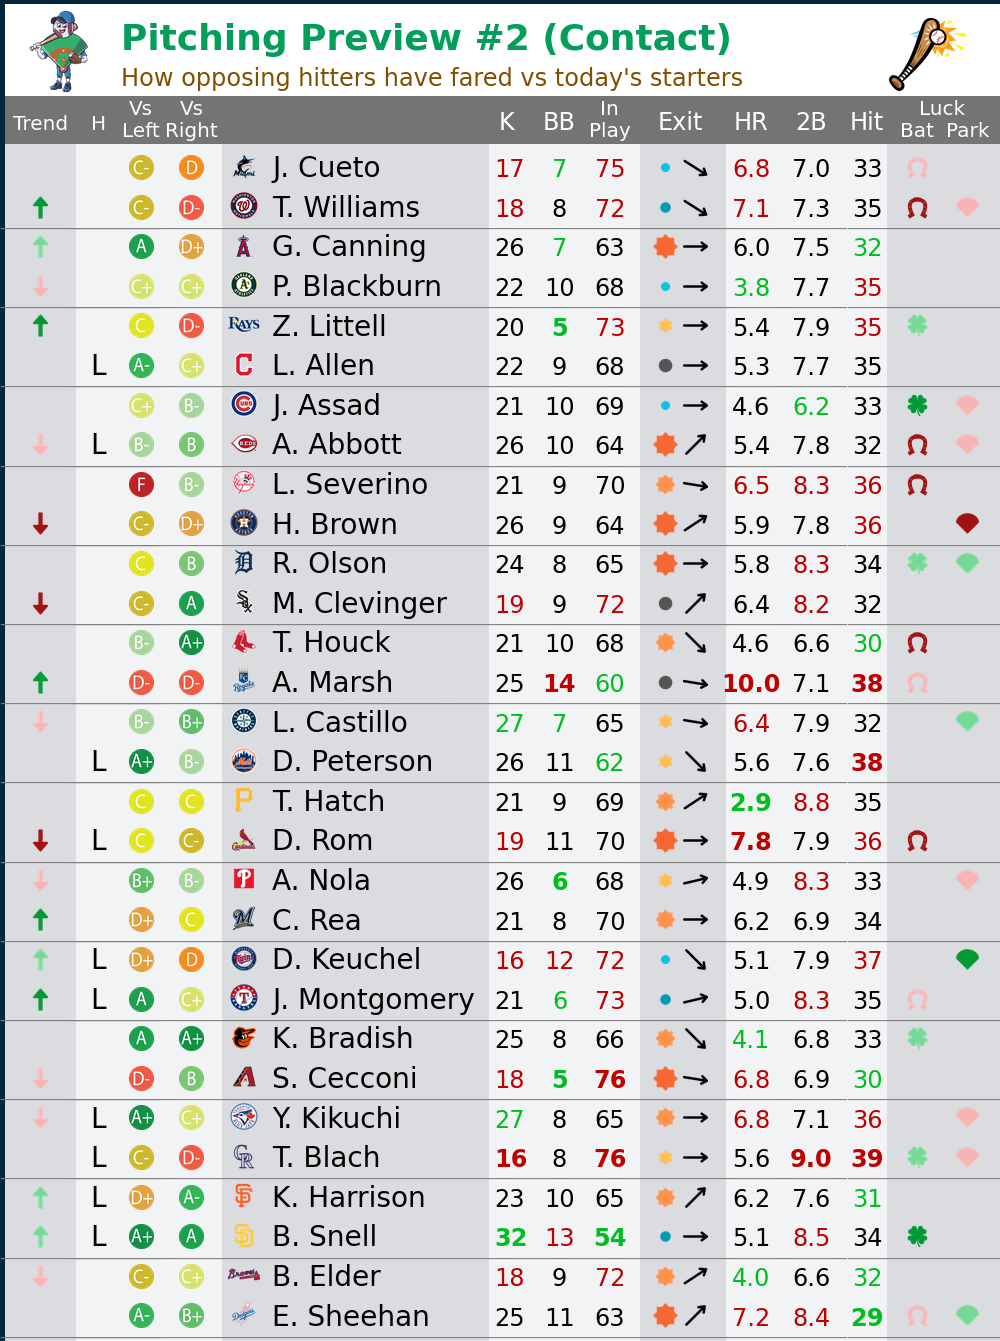
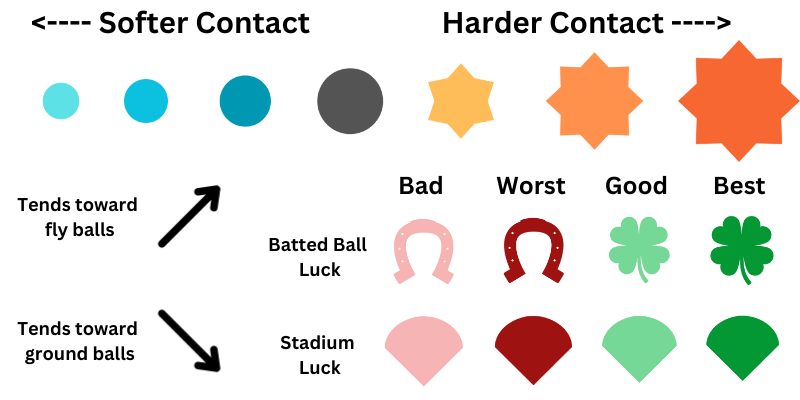
Page 3: Pitching Preview #2 (Contact)
This sheet focuses on the batted ball outcomes allowed by each pitcher on today's slate. It uses an expectations model to control for park and luck factors. While contact quality is a more direct indication of how a pitcher has performed, it can be more random and less predictive than focusing on pitch quality (previous page).
The numbers on this sheet are percentages on a plate-appearance basis. For example, 6.8 = 6.8% of plate appearances.
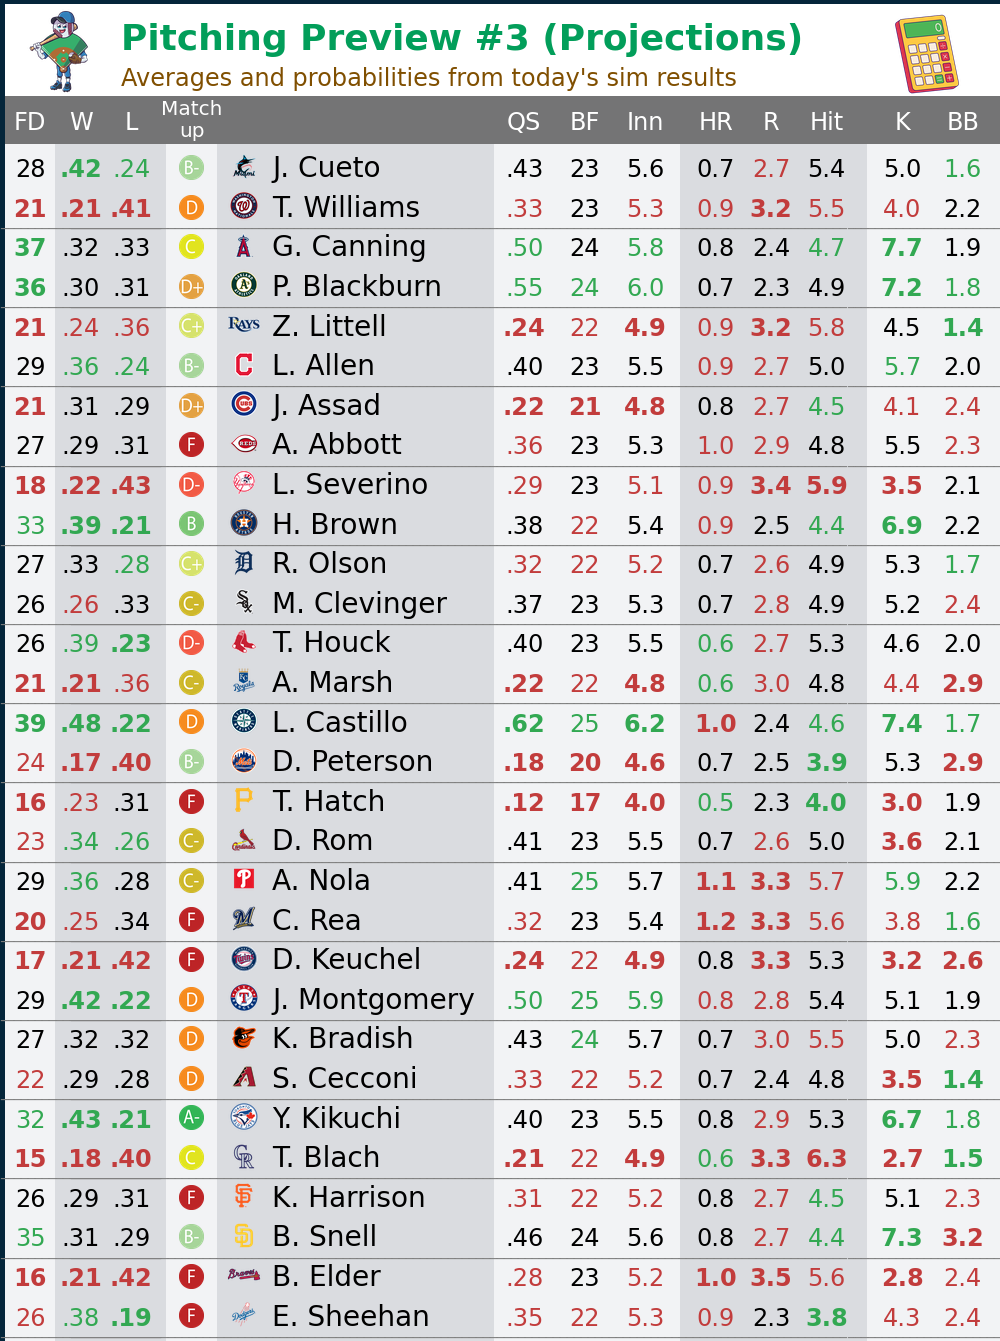
Page 4: Pitching Preview #3 (Projections)
This sheet gives individual projections for each pitcher on today's slate. They come directly from game simulations. which utilize all available information about the pitcher, opponent, and environment (park and weather).
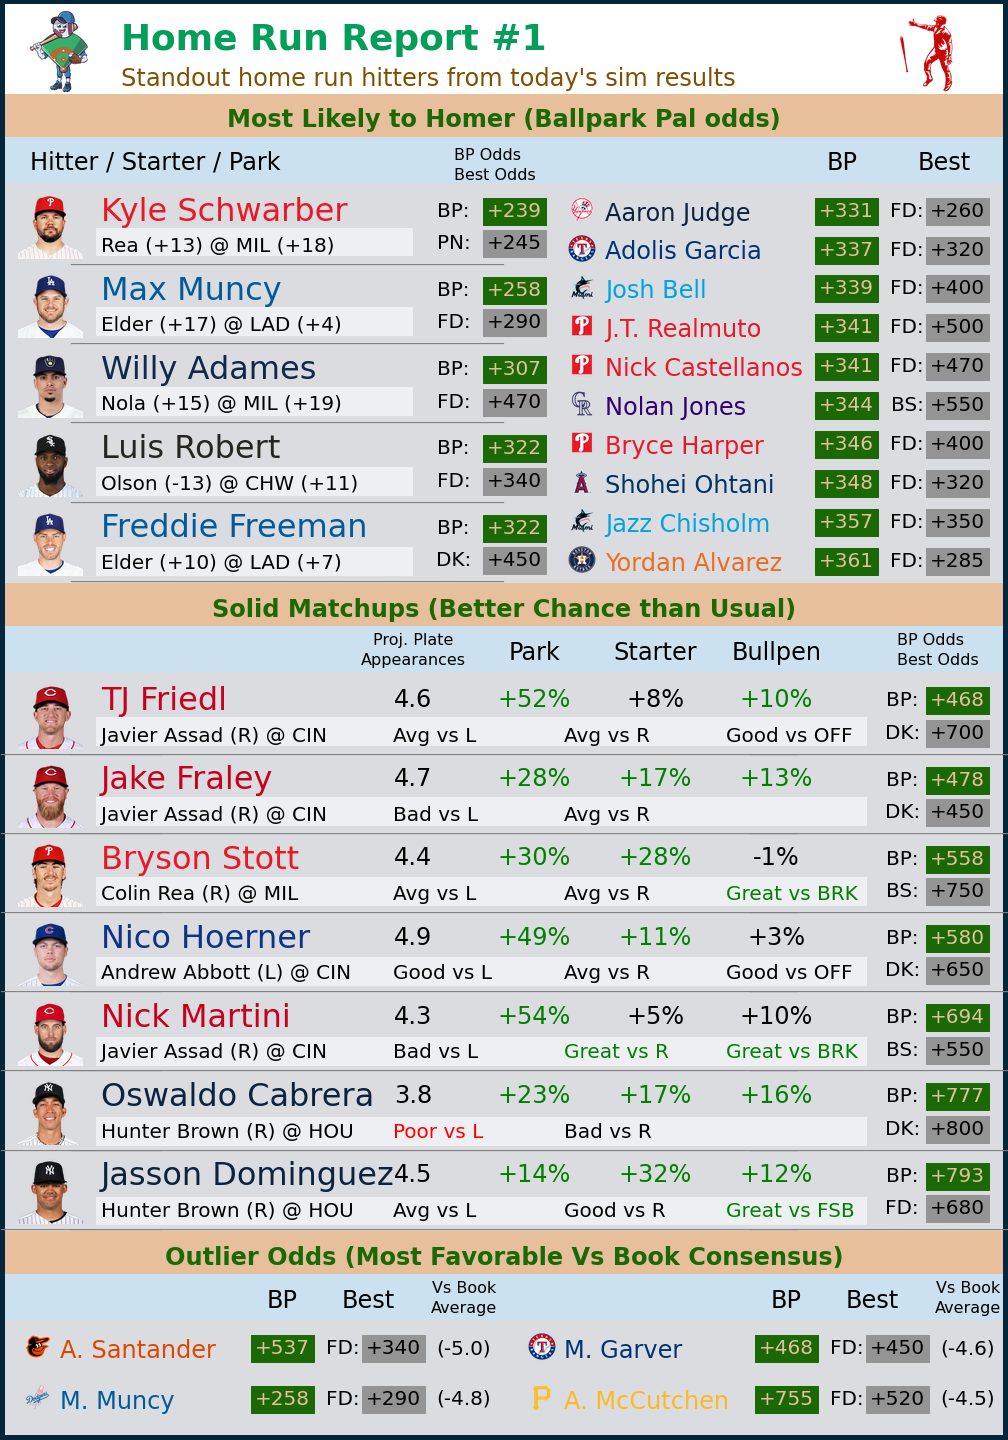
Page 5: Home Run Report #1
This sheet provides a list of players from today's slate that are notable from a home run perspective. The "Most Likely to Homer" section lists the hitters with the best chance at hitting a home run, according to Ballpark Pal simulations. The "Solid Matchups" section shows players who have a notable boost in home run likelihood, according to the Matchup Model. In other words, they're more likely to hit a home run than usual based on the park, starting pitcher, and bullpen they're facing. The "Outlier Odds" section gives book odds that are farthest out of line from other books.
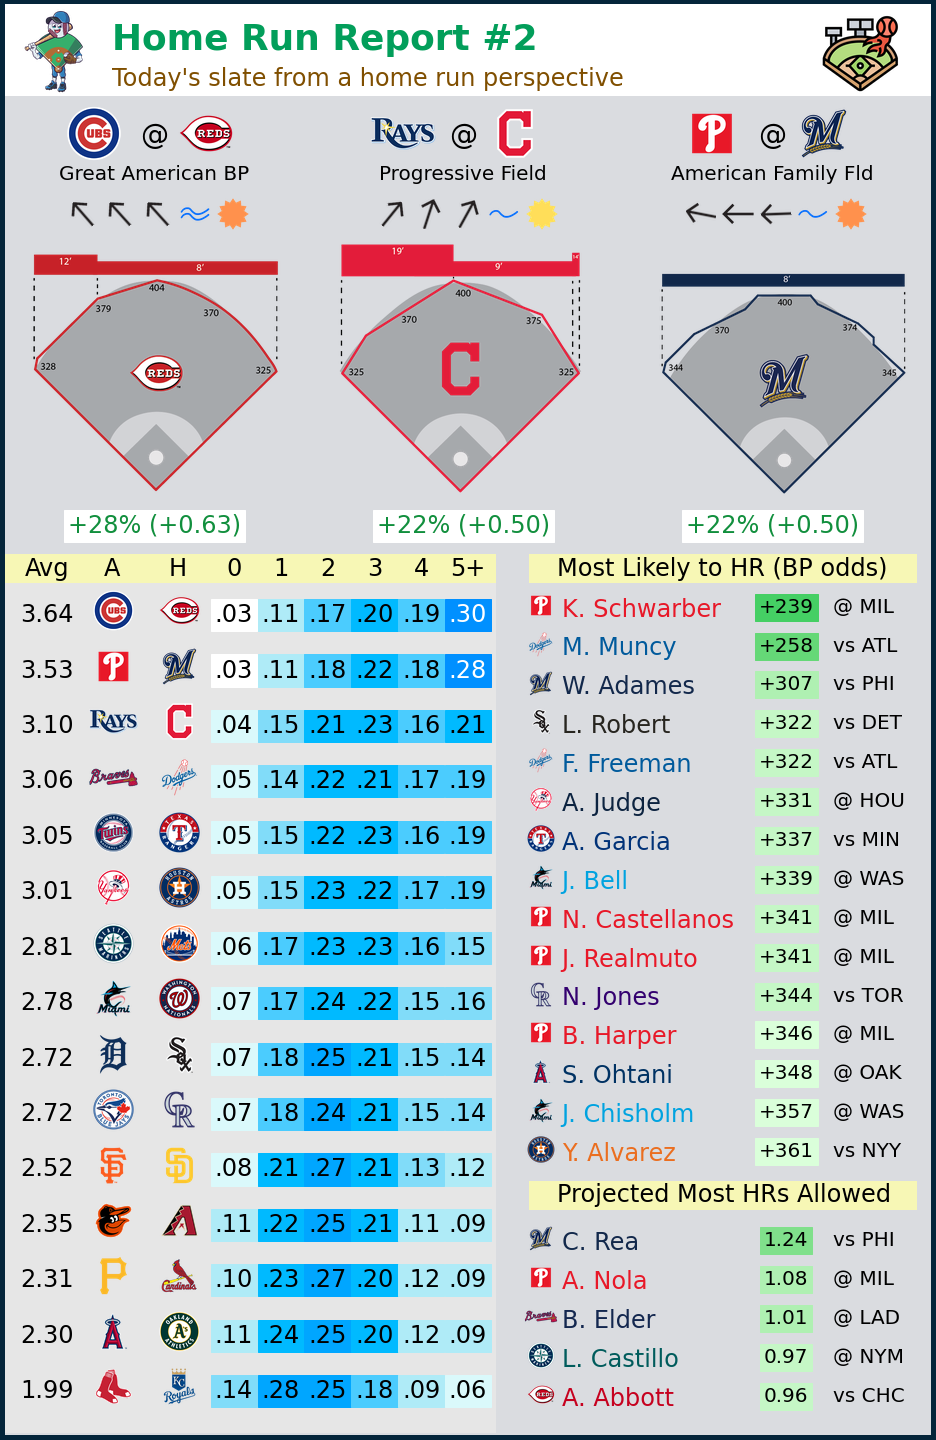
Page 6: Home Run Report #2
This sheet gives a general view of today's slate from a home run perspective. The top 3 parks for home runs are shown at the top (weather accounted for). Home run distributions are provided for each game. For example, game simulations assign the Cubs/Reds game a 30% chance of featuring 5 or more home runs. The "Most Likely to HR" and "Projected Most HRs Allowed" sections come directly from the sims.
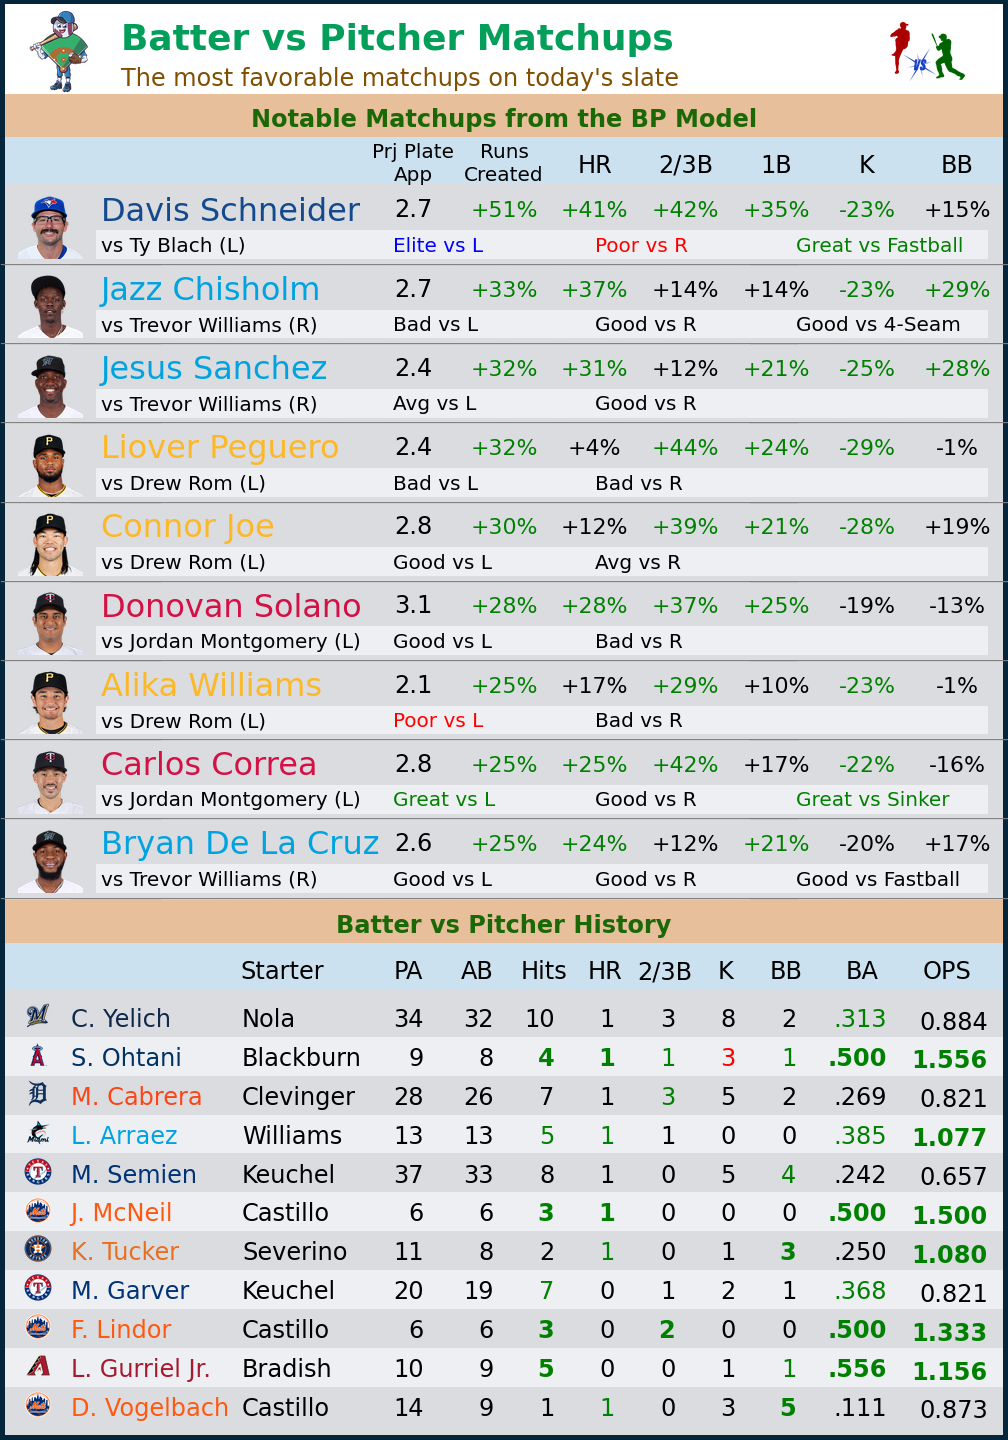
Page 7: Batter vs Pitcher Matchups
This sheet is an overview of today's batter vs starting pitcher matchups. The upper portion is a list of players with better-than-normal matchups vs the opposing starter, according to the Ballpark Pal matchup model. The list is sorted by runs created, which is a weighted average of all the various outcomes (home run, single, walk, etc.) based on how important each is to scoring runs. The percentages are relative to the hitter's normal expectation. So if they're normally expected to homer 2% of the time, +50% would mean they have a 3% chance today.
The lower half is a list of players with good history vs the opposing starter. The list is sorted by a combination of runs created and overall plate appearances.
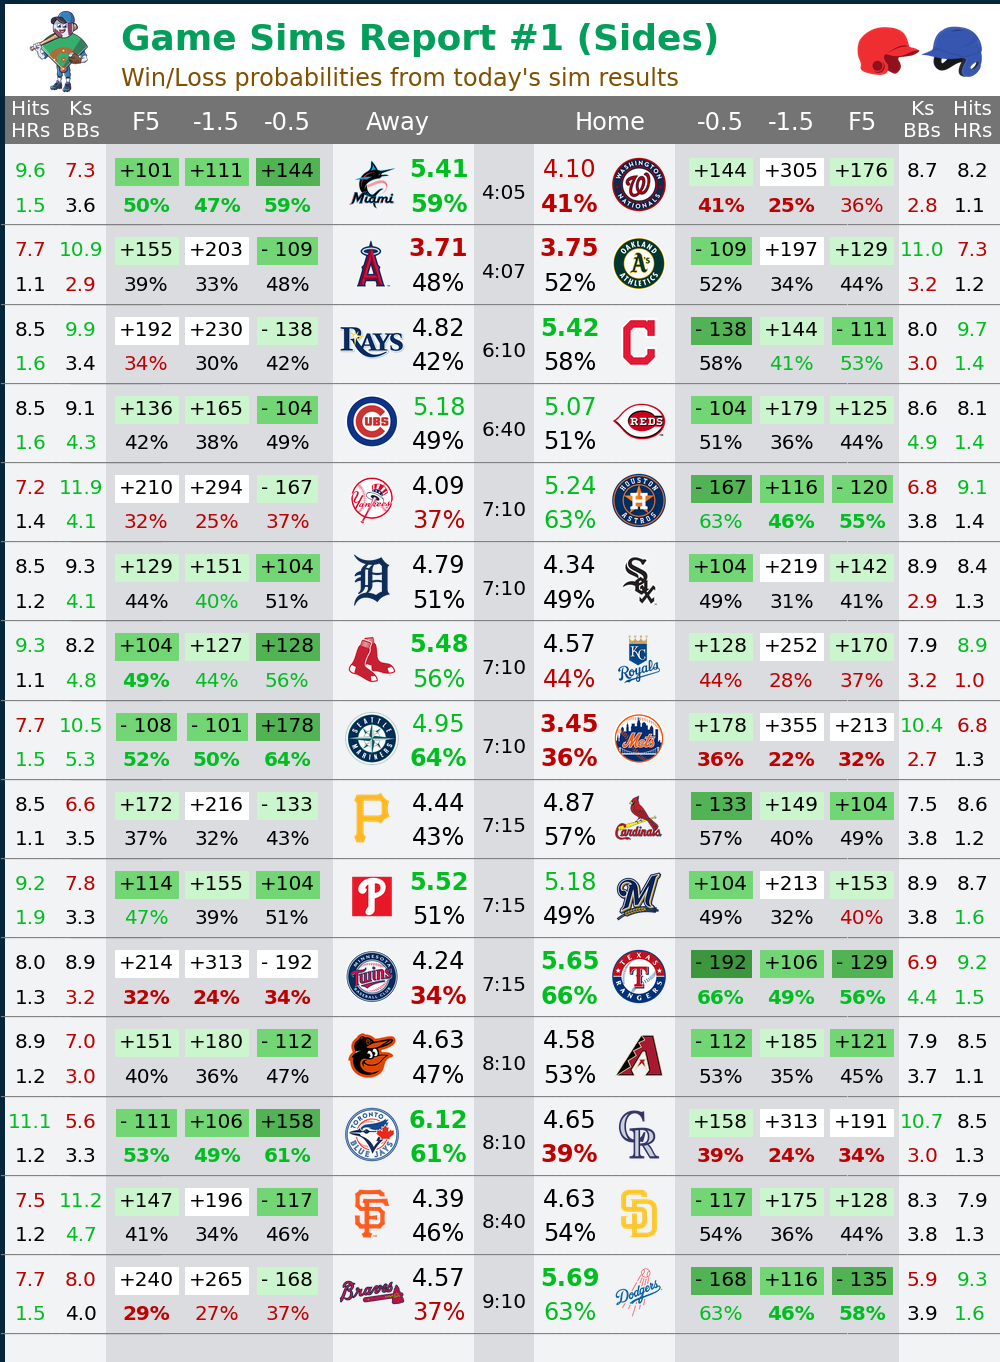
Page 8: Game Sims Report #1 (Sides)
This sheet is a rundown of sim results for every game on today's slate from a sides perspective. Win percentages come directly from Implied odds are based on the probabilities in the sim results and do not contain vig. Runs, hits, home runs, strikeouts, and walks are averages from the sim results.
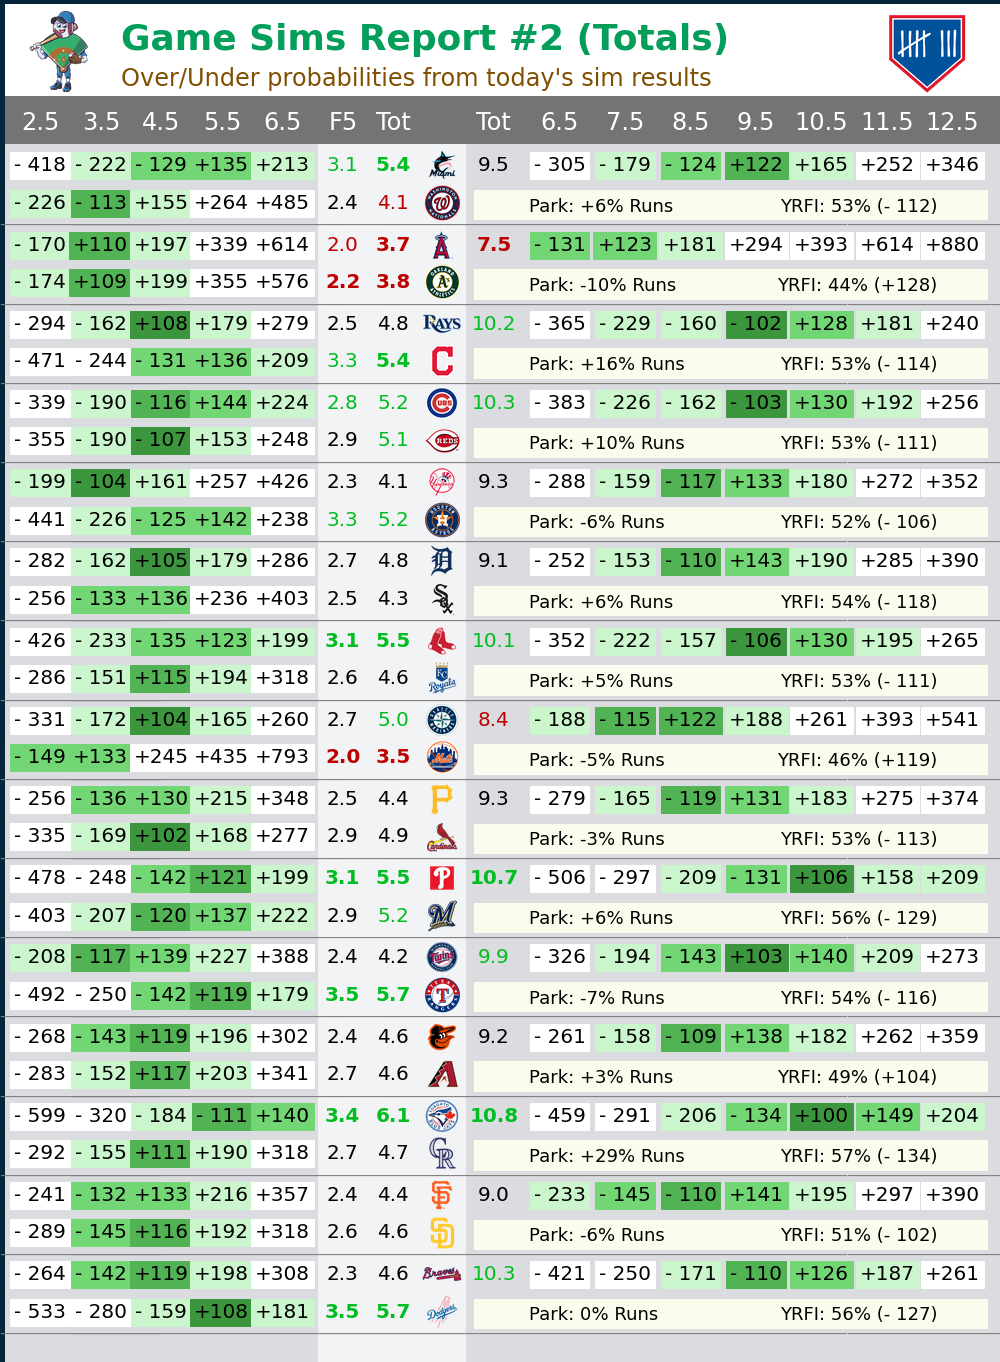
Page 9: Game Sims Report #2 (Totals)
This sheet is a rundown of sim results for every game on today;s slate from a totals perspective. All percentages are the probability of going over the specified number of runs, based on the game simulations. Run totals (F5 and Tot) are averages from the sim results.
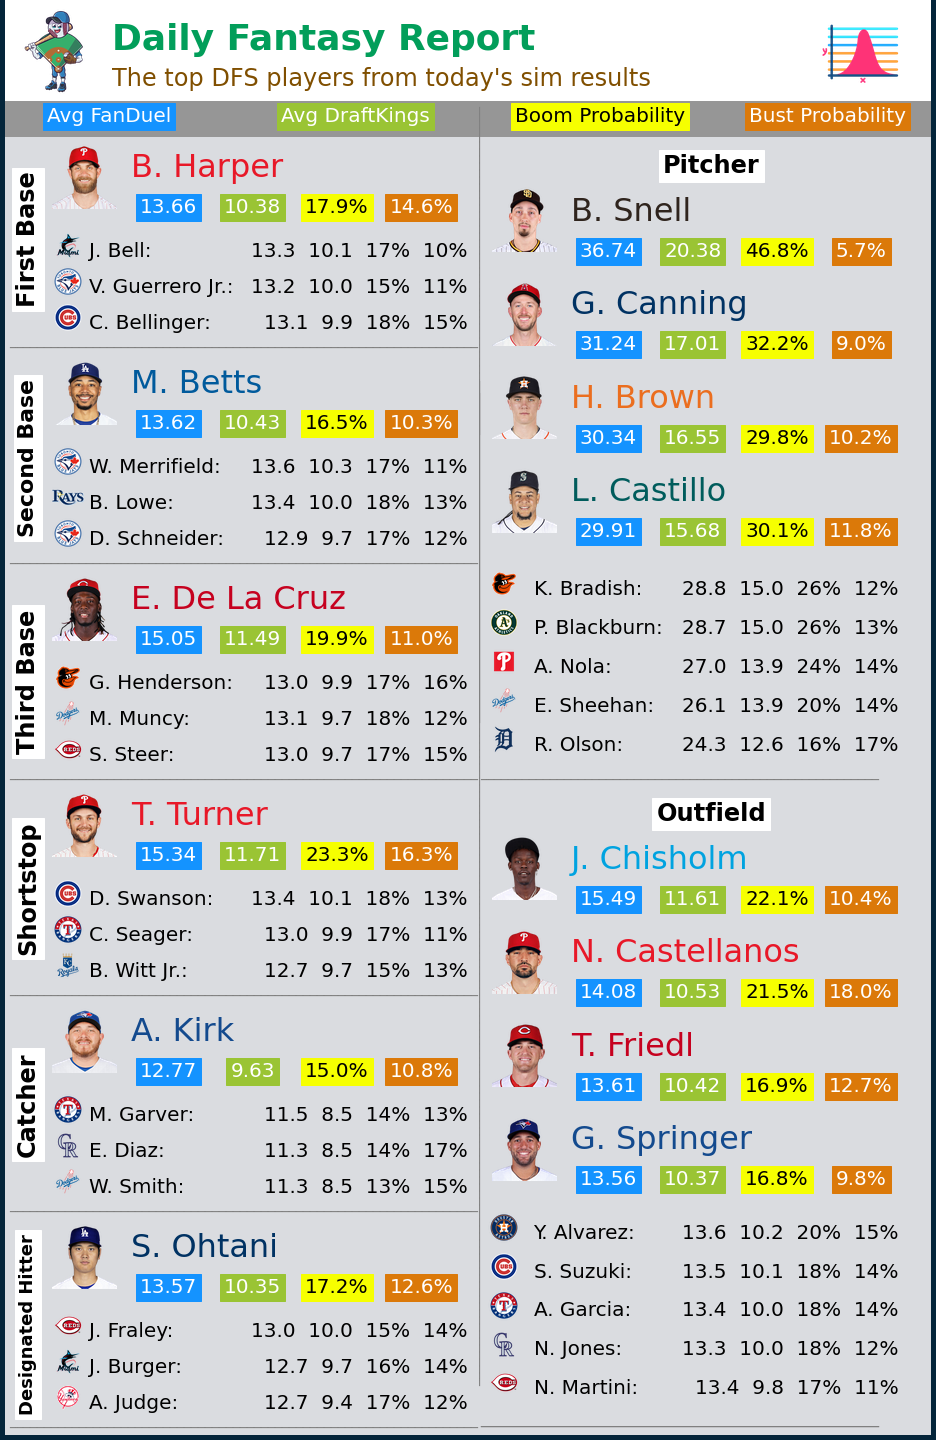
Page 10: Daily Fantasy Report
This sheet is a summary of the top players on today's slate by position from a DFS perspective. FD (FanDuel) and DK (DraftKings) are average fantasy point totals from the game simulations.. "Boom" is the probability of a pitcher scoring more than 40 FD points and a hitter scoring more than 25 FD points. "Bust" is the probability of a pitcher scoring fewer than 10 FD points and a hitter scoring 0 FD points.
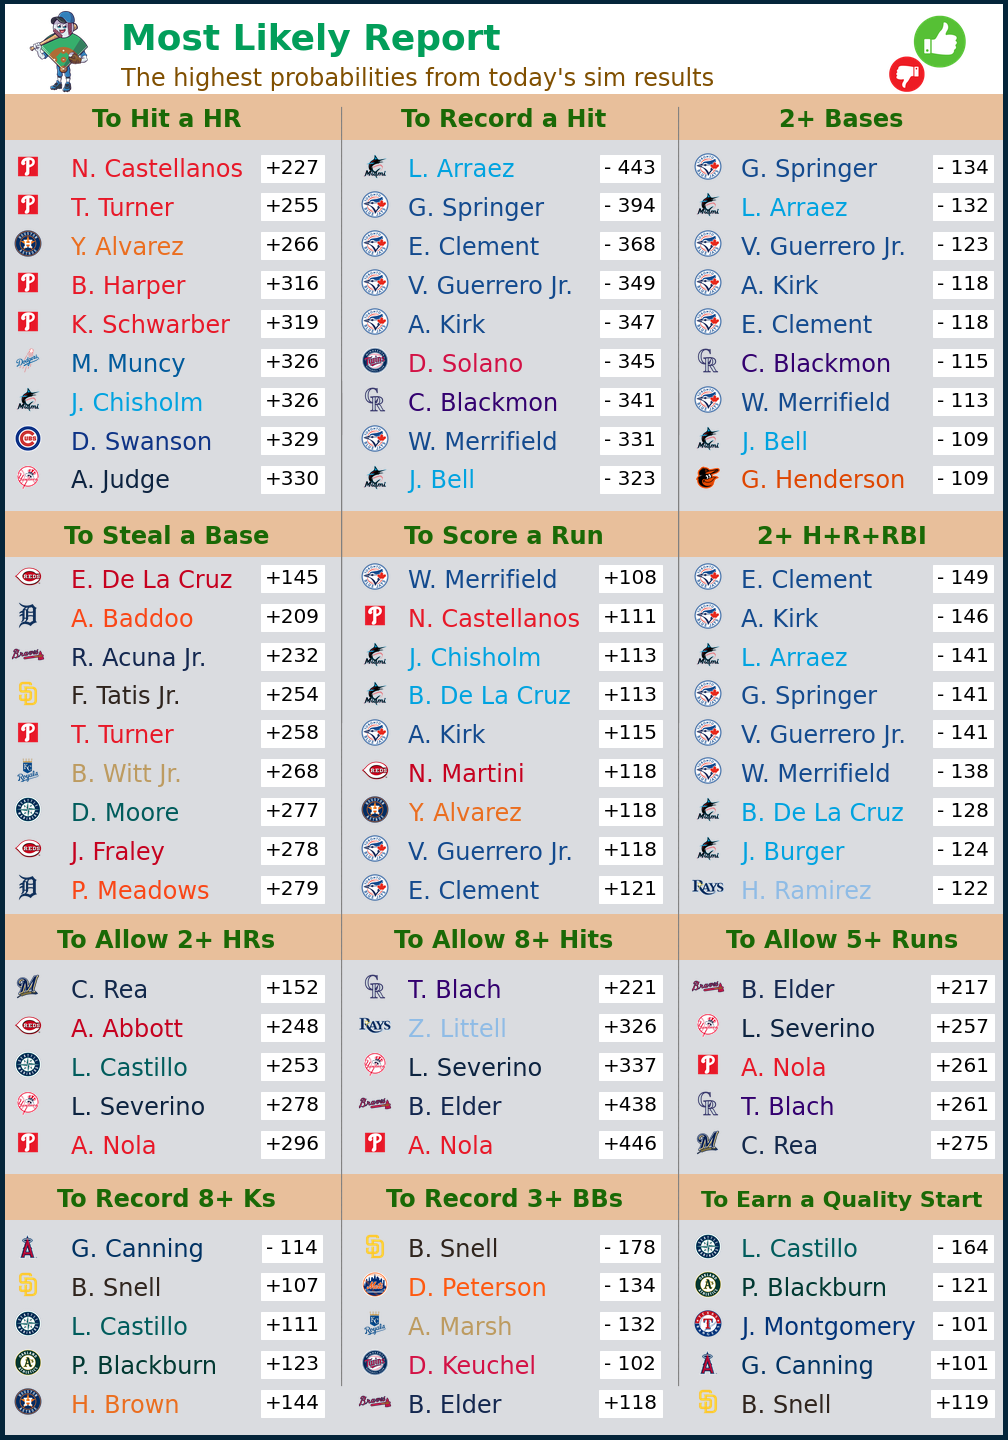
Page 11: Most Likely Report
This sheet is a summary of players most likely to do various things on today's slate. Odds are implied from the probabilities in Ballpark Pal game simulations.
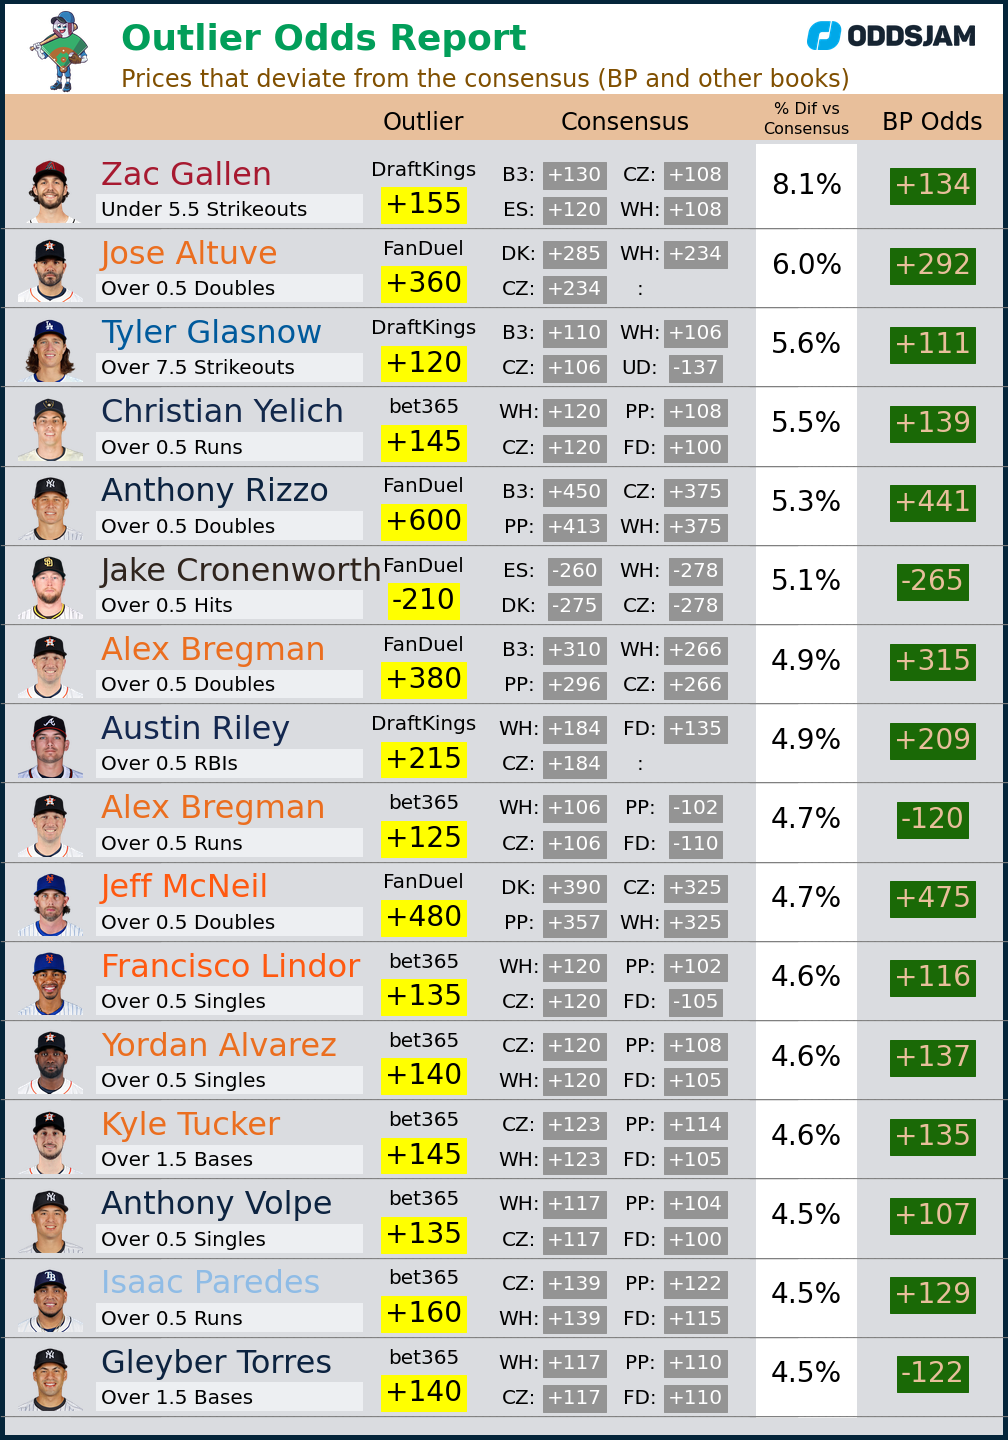
Page 12: Outlier Odds Report
This sheet is a list of current odds that deviate most from the book consensus and Ballpark Pal game simulations.Odds are sorted by "% vs book consensus", which is the probability difference in the implied odds. For instance, if FanDuel assigns +400 (20% chance) and the books average +300 (25% chance) then this metric equals 5% (the difference between the probabilities). Live odds are provided by OddsJam.
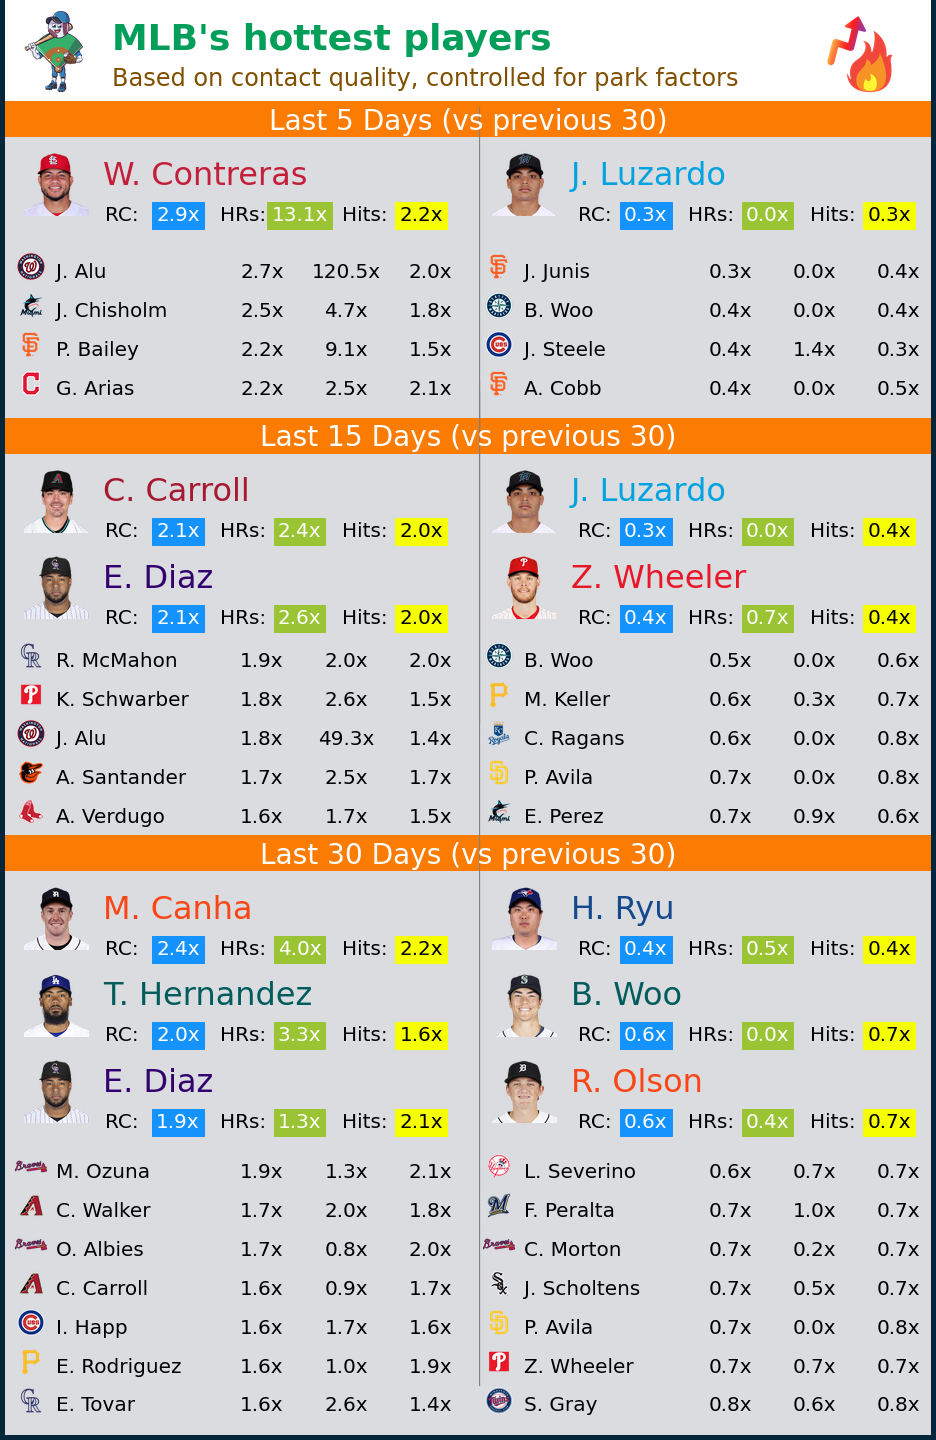
Page 13: MLB's Hottest Players
This sheet is a list of the players who have been playing better than their typical expected level (measured by 30 days prior). Players are sorted by RC (Runs Created), which is a weighted metric based on how the various outcomes (single, home run, walk, etc.) relate to scoring runs. 2.5x hits for a hitter means they're averaging 2.5 times more hits-per-plate-appearance than they were in the prior 30 days. 0.3x hits for a pitcher means they're allowing 30% of the total hits-per-plate-appearance (70% fewer) vs the prior 30 days.
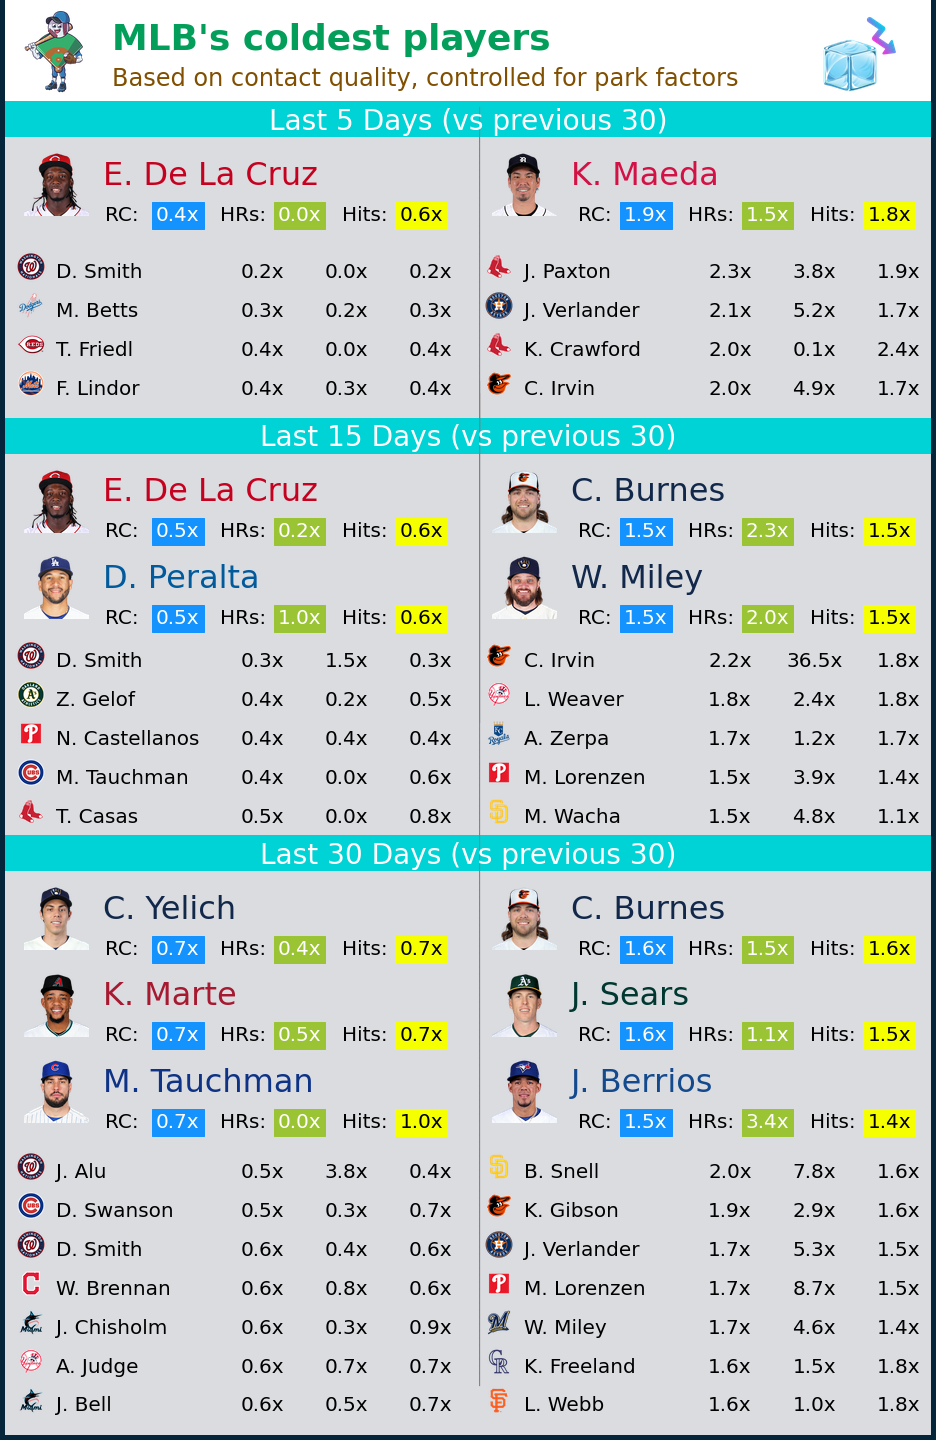
Page 14: MLB's Coldest Players
This sheet is a list of the players who have been playing worse than their typical expected level (measured by 30 days prior). Players are sorted by RC (Runs Created), which is a weighted metric based on how the various outcomes (single, home run, walk, etc.) relate to scoring runs. 0.3x hits for a hitter means they're averaging 30% of the total hits-per-plate-appearance (70% fewer) vs the prior 30 days. 2.5x hits for a pitcher means they're allowing 2.5 times more hits-per-plate-appearance than they were over the prior 30 days.
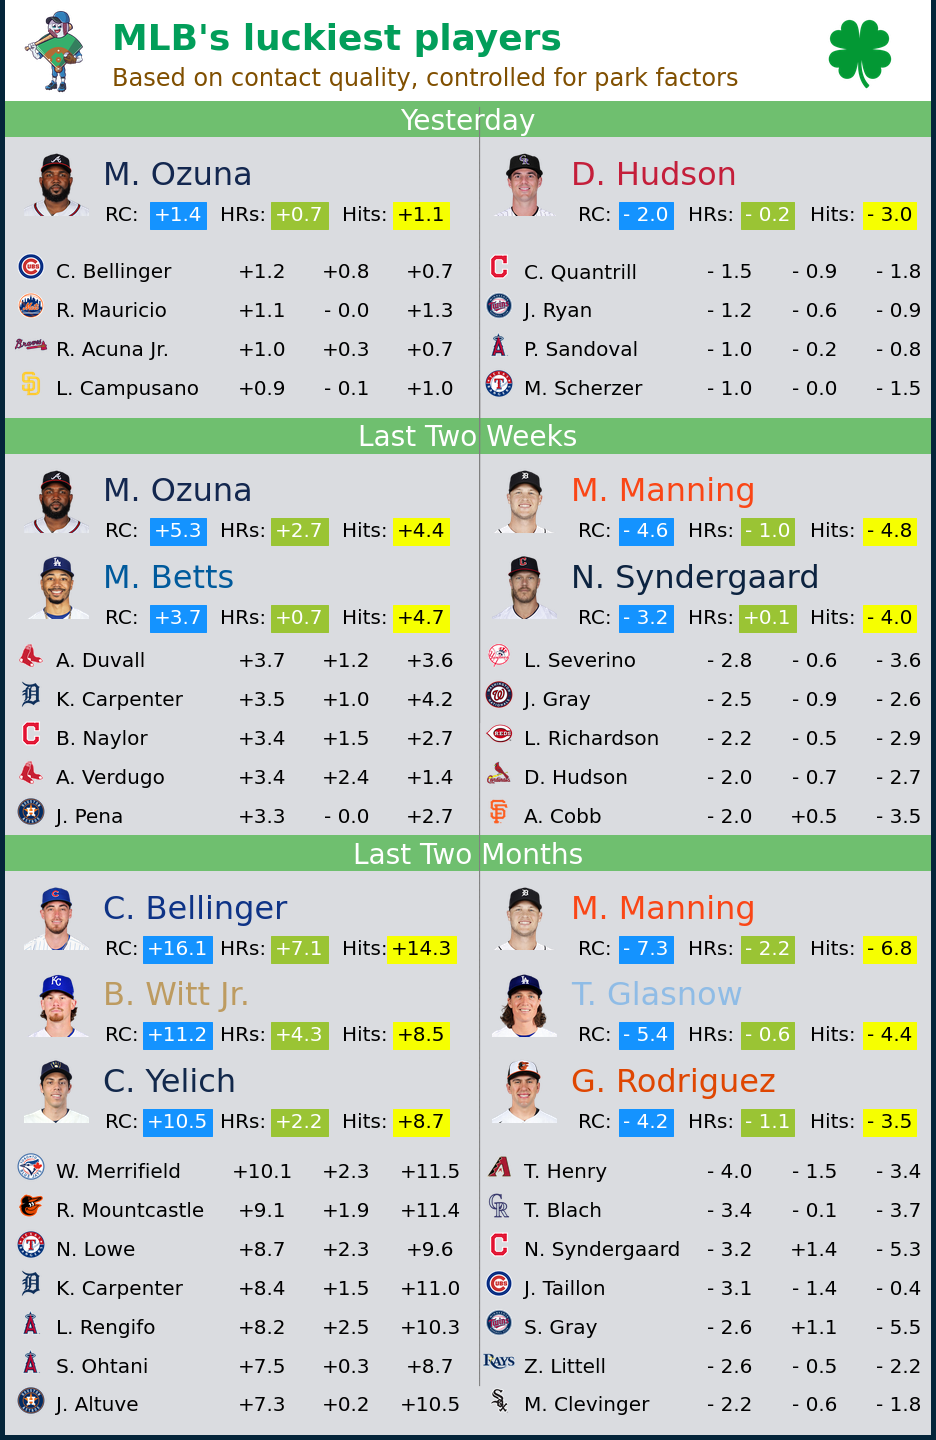
Page 15: MLB's Luckiest Players
This sheet is a list of the players who have recently benefitted from the most luck. Luck is defined as the difference between actual and expected outcomes. An example of good luck for a hitter could be a weak ground ball hit in the perfect spot or an unspectacular pop fly that manages to make it over the fence due to a shallow field and/or favorable conditions.
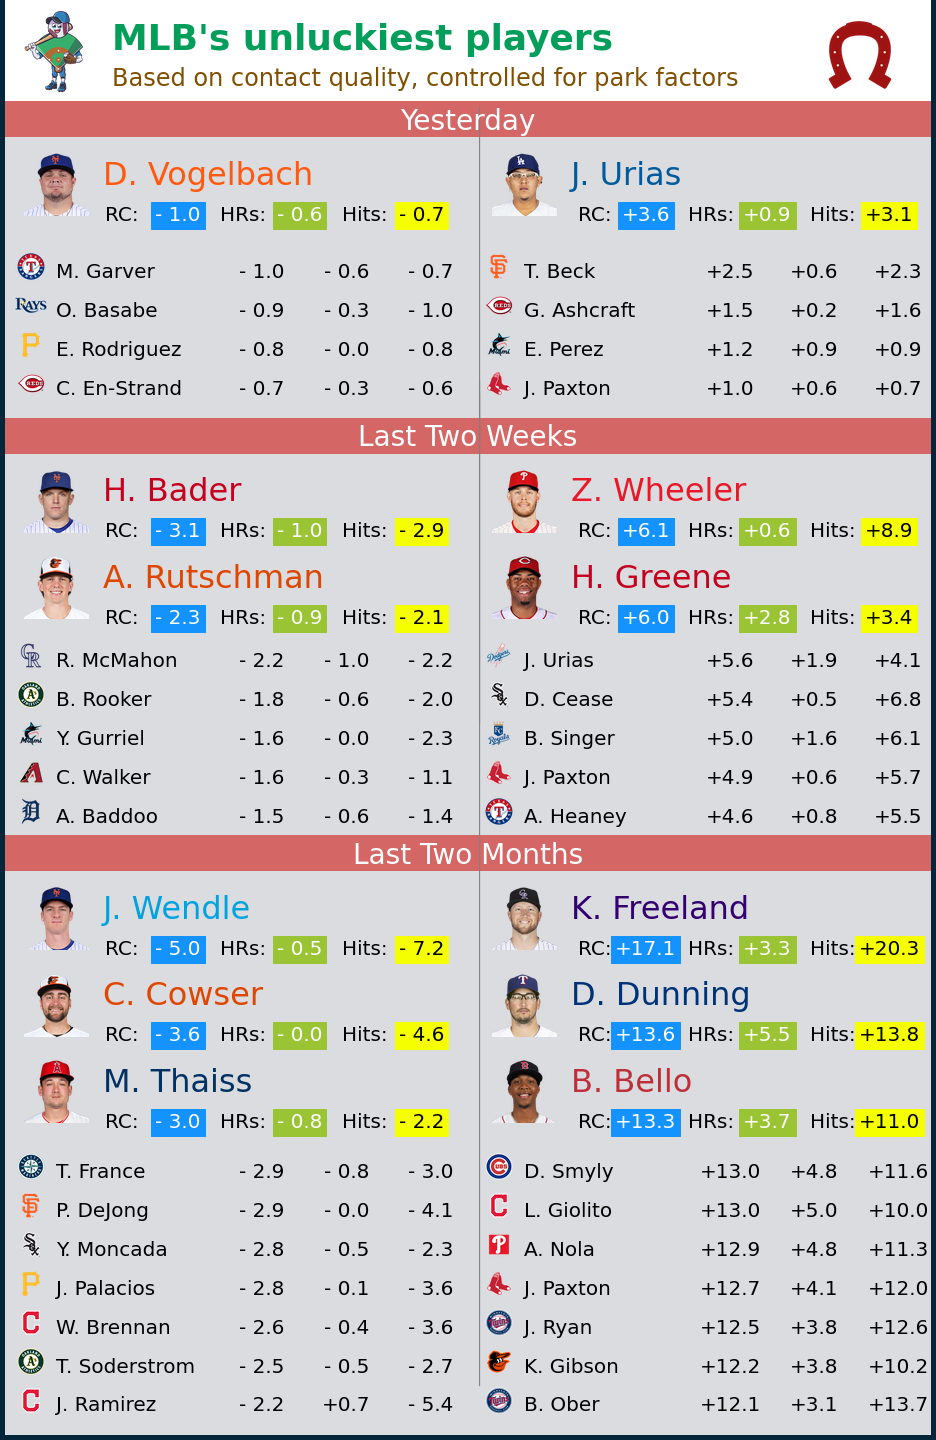
Page 16: MLB's Unluckiest Players
This sheet is a list of the players who have recently benefitted from the most luck. Luck is defined as the difference between actual and expected outcomes. An example of bad luck for a hitter could be a hard line drive hit directly at the third baseman or a near home run hit to a deep section of a difficult park that gets knocked down by the wind.
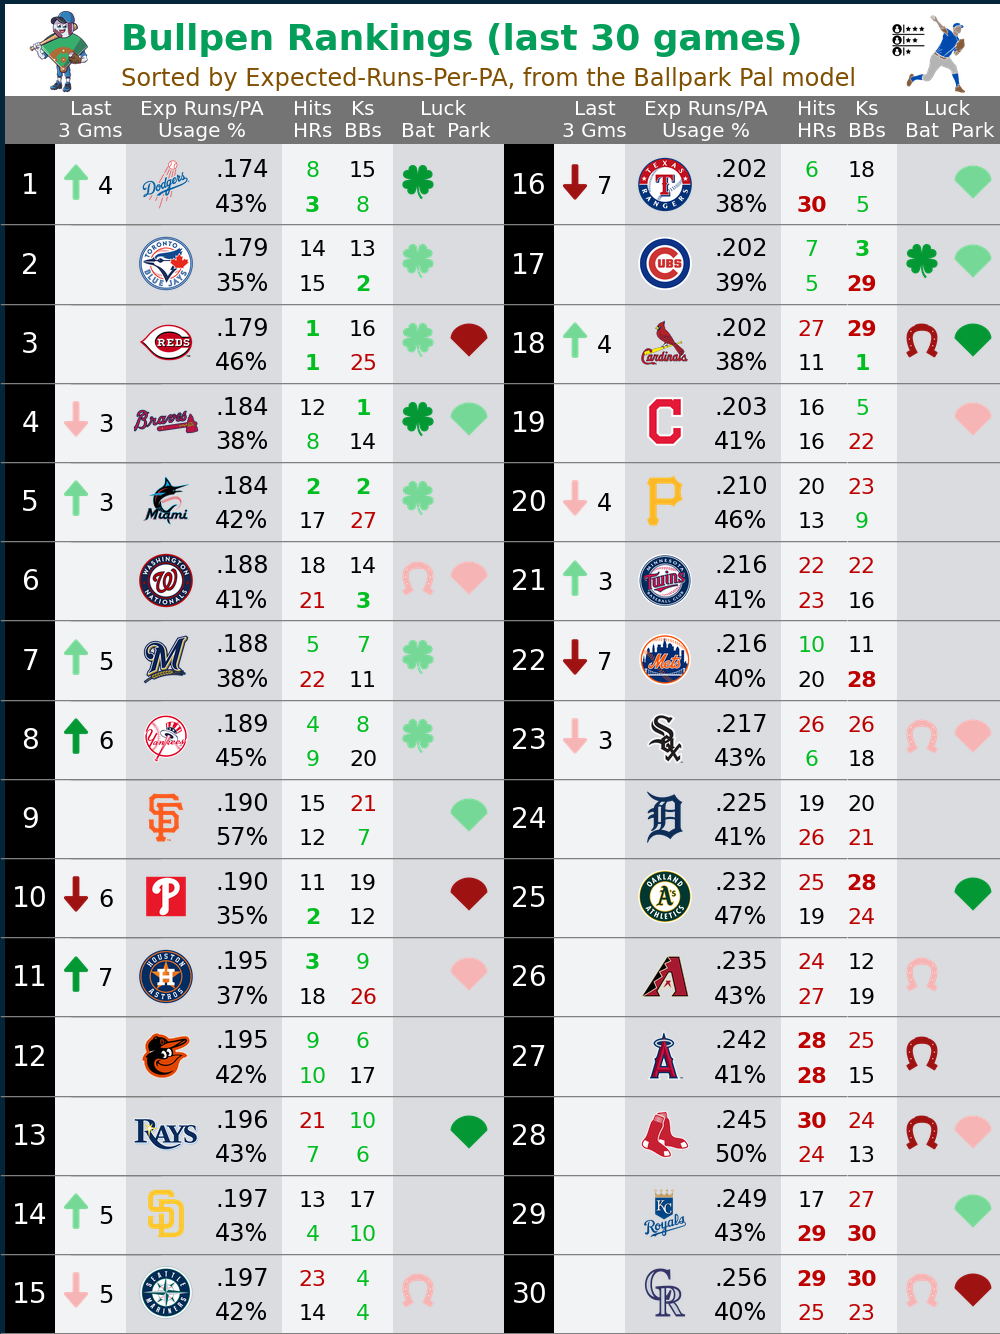
Page 17: Bullpen Rankings
This sheet gives a ranking of all 30 bullpens in MLB over the past 30 days. The sorting metric is expected-runs-per-plate-appearance as determined by batted-ball expectations. Hits, home runs, strikeouts, and walks are 1-30 rankings from these same models. Luck is the difference expected and actual outcomes, split into batted ball luck and luck related to stadiums/park factors.
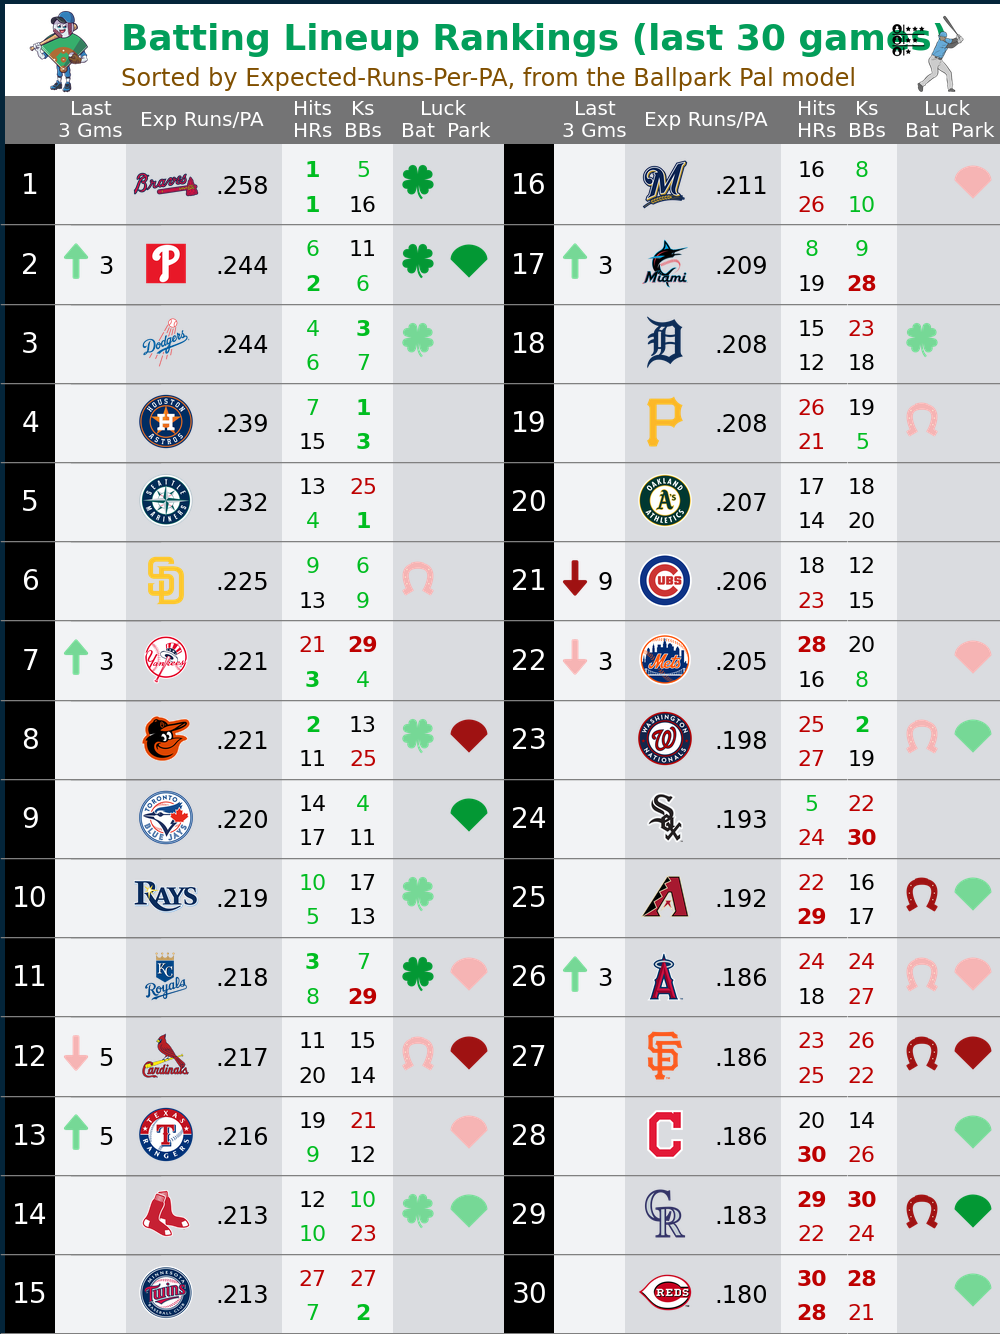
Page 18: Batting Lineup Rankings
This sheet gives a ranking of all 30 batting lineups in MLB over the past 30 days. The sorting metric is expected-runs-per-plate-appearance as determined by batted-ball expectations. Hits, home runs, strikeouts, and walks are 1-30 rankings from these same models. Luck is the difference expected and actual outcomes, split into batted ball luck and luck related to stadiums/park factors.
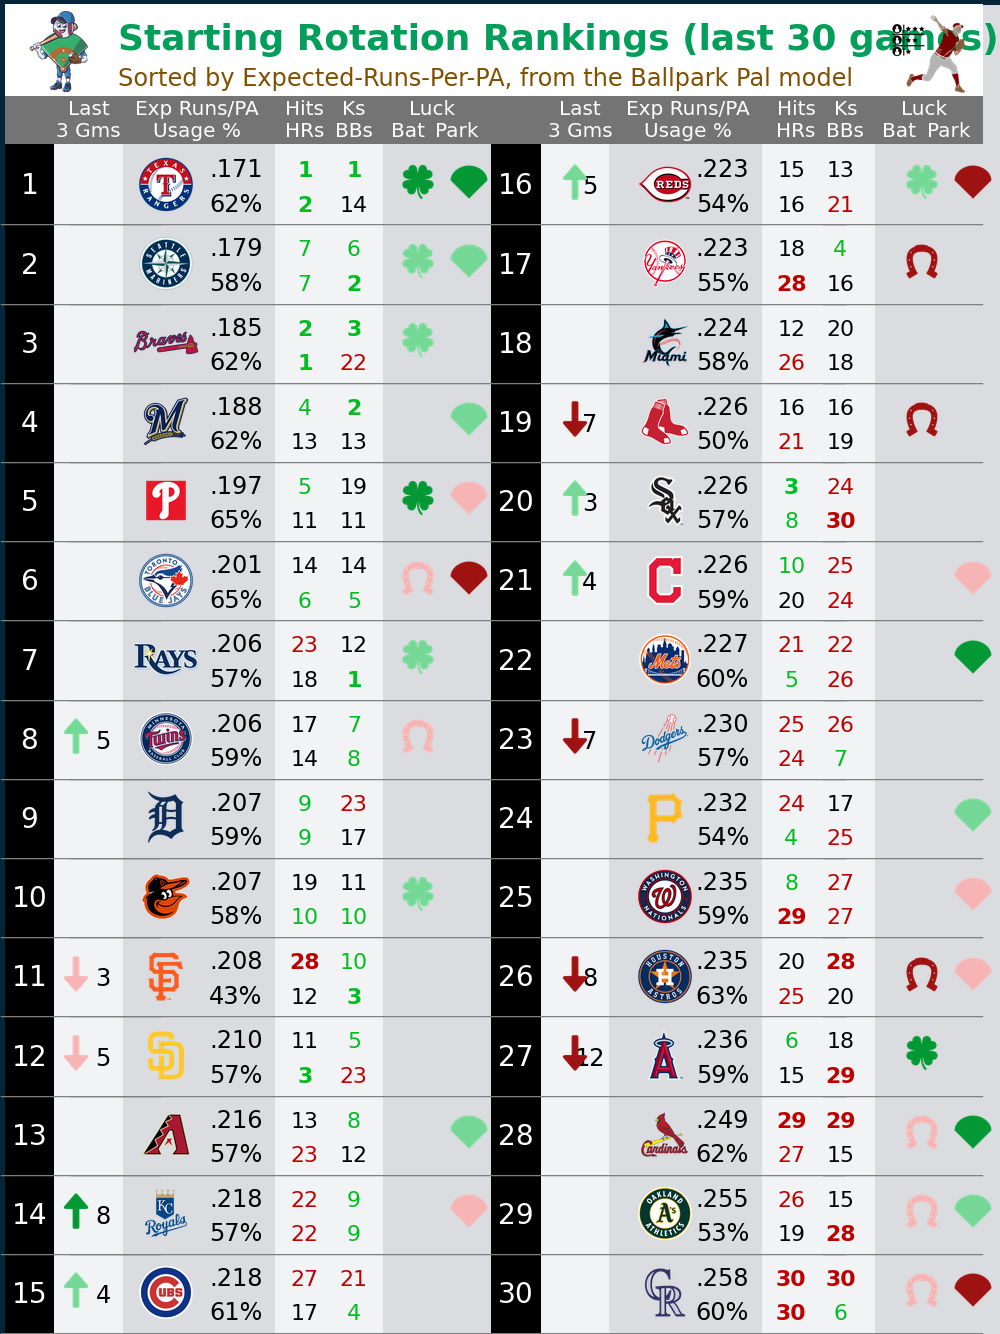
Page 19: Rotation Rankings
This sheet gives a ranking of all 30 starting pitcher rotations in MLB over the past 30 days. The sorting metric is expected-runs-per-plate-appearance as determined by batted-ball expectations. Hits, home runs, strikeouts, and walks are 1-30 rankings from these same models. Luck is the difference expected and actual outcomes, split into batted ball luck and luck related to stadiums/park factors.
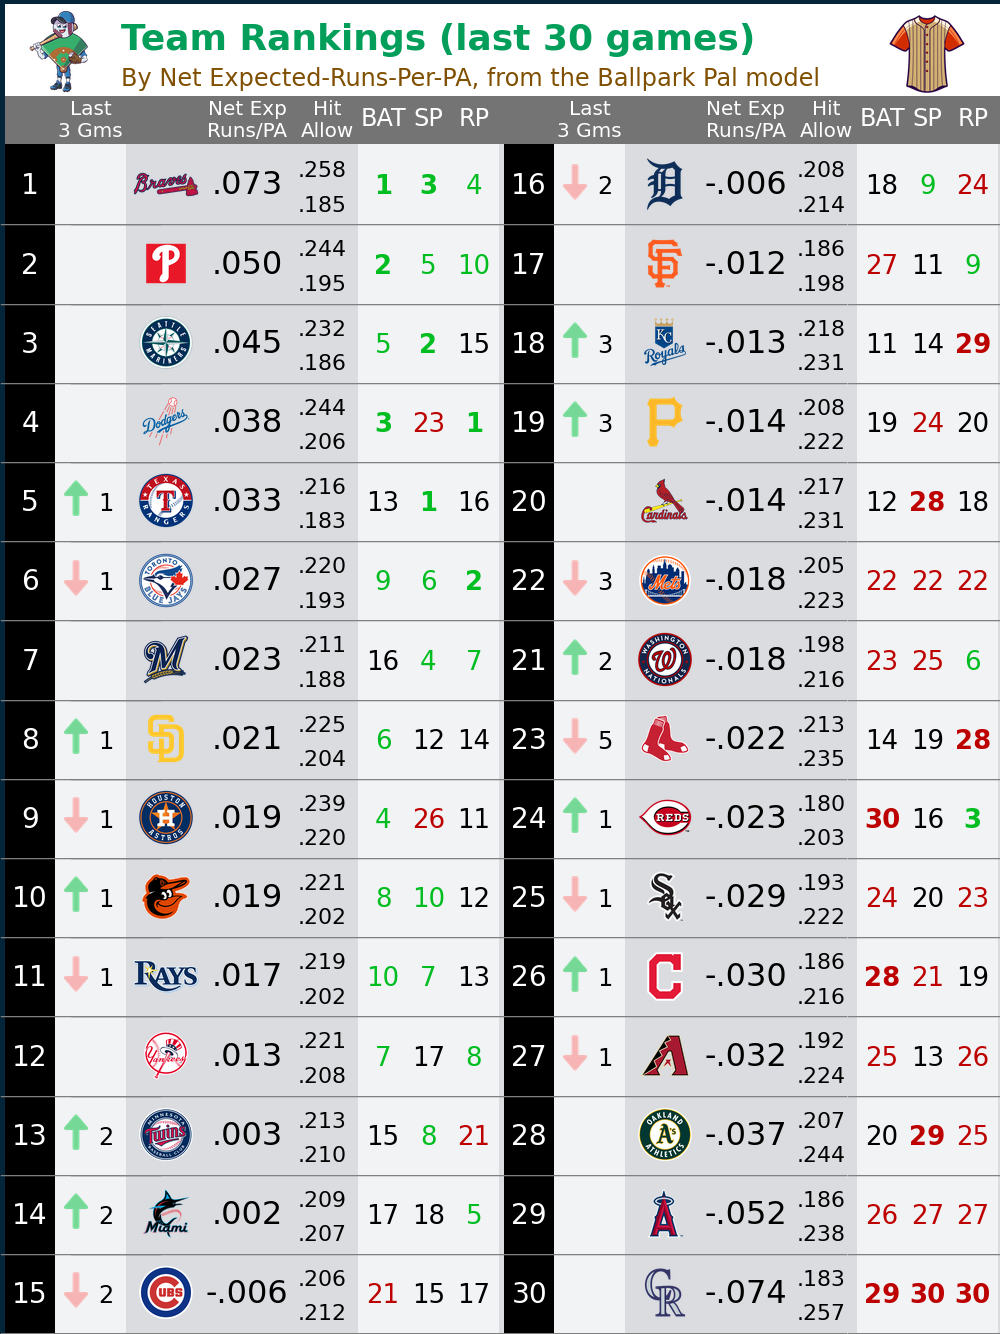
Page 20: Team Rankings
This sheet gives a ranking of all 30 teams in MLB over the past 30 days. The sorting metric is net expected-runs-per-plate-appearance as determined by batted-ball expectations. The "net" portion of the equation refers to offense (Hit) minus defense (Allow). BAT (batting), SP (starting pitching), and RP (relief pitching) are 1-30 rankings from these same models.
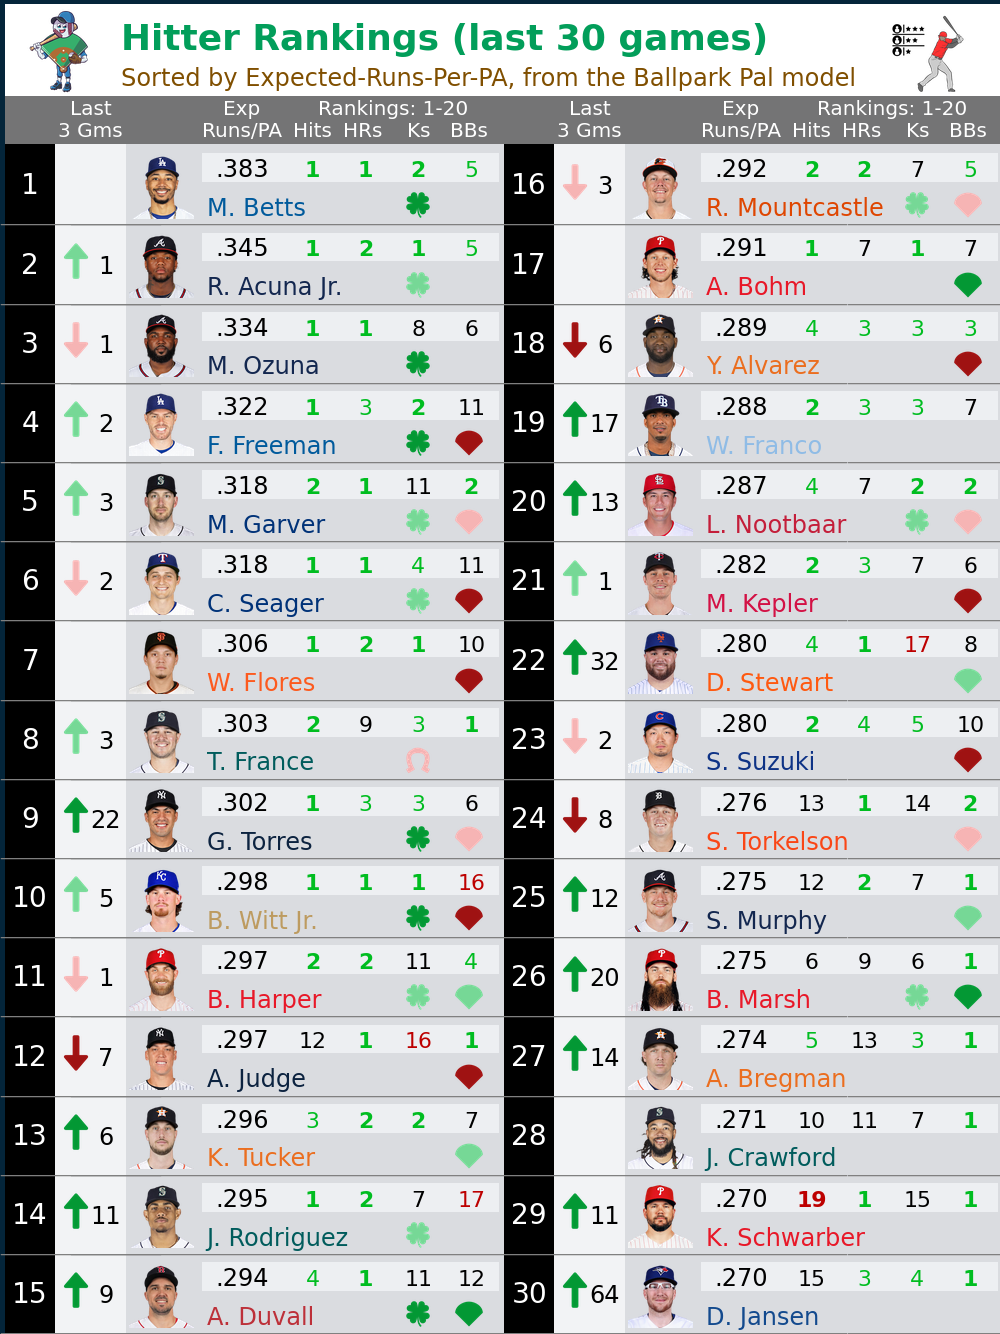
Page 21: Hitter Rankings
This sheet ranks the top 30 hitters in MLB over the past 30 days. The sorting metric is expected-runs-per-plate-appearance as determined by batted-ball expectations. Hits, home runs, strikeouts, and walks are 1-30 rankings from these same models. Luck is the difference expected and actual outcomes, split into batted ball luck and luck related to stadiums/park factors.
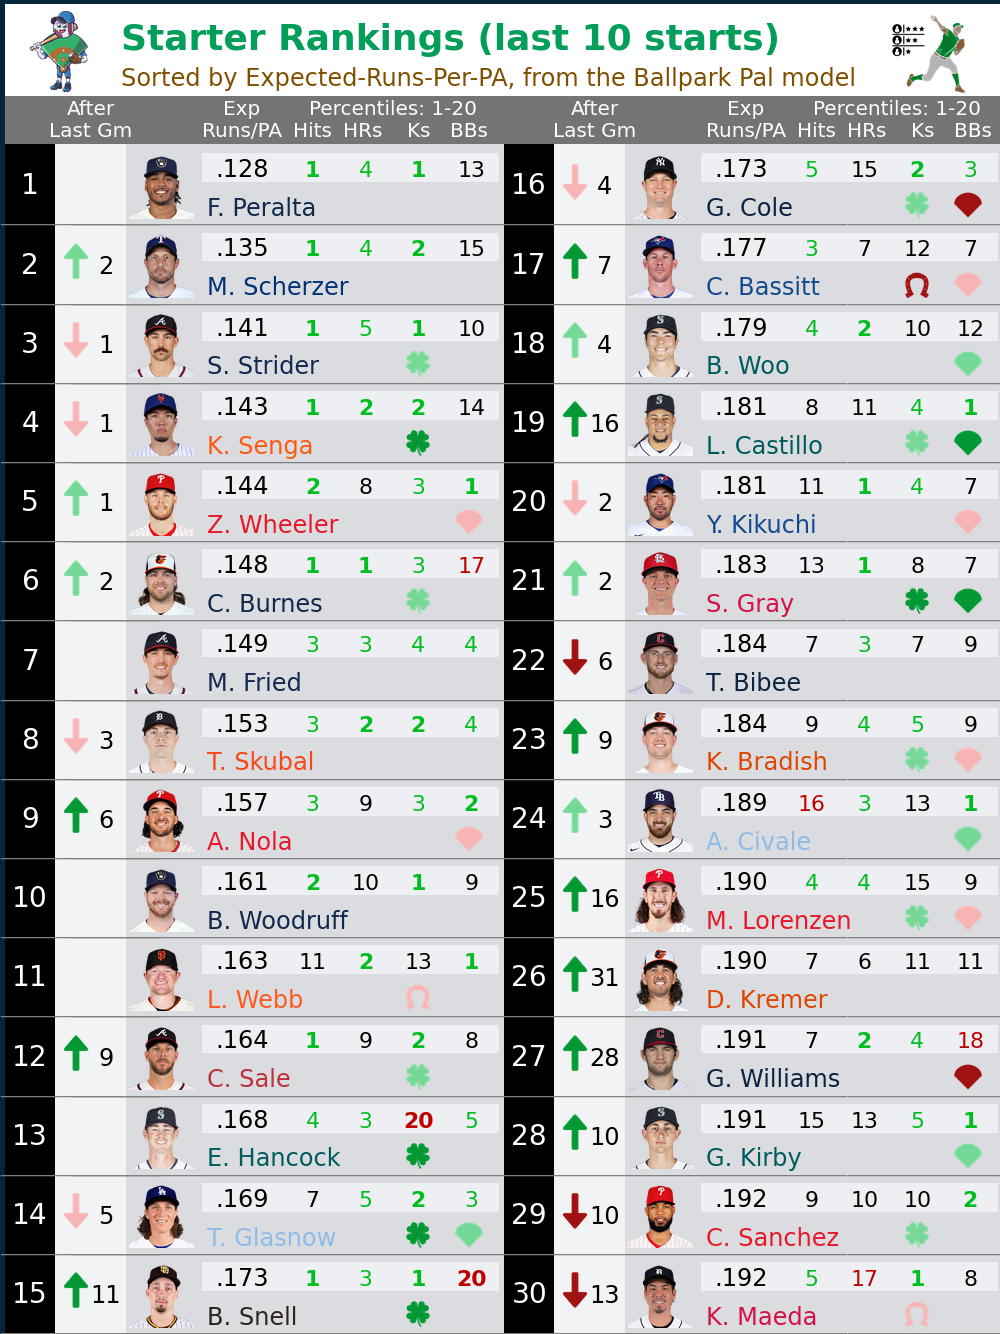
Page 22: Starter Rankings
This sheet ranks the top 30 starting pitchers in MLB over the past 30 days. The sorting metric is expected-runs-per-plate-appearance as determined by batted-ball expectations. Hits, home runs, strikeouts, and walks are 1-30 rankings from these same models. Luck is the difference expected and actual outcomes, split into batted ball luck and luck related to stadiums/park factors.
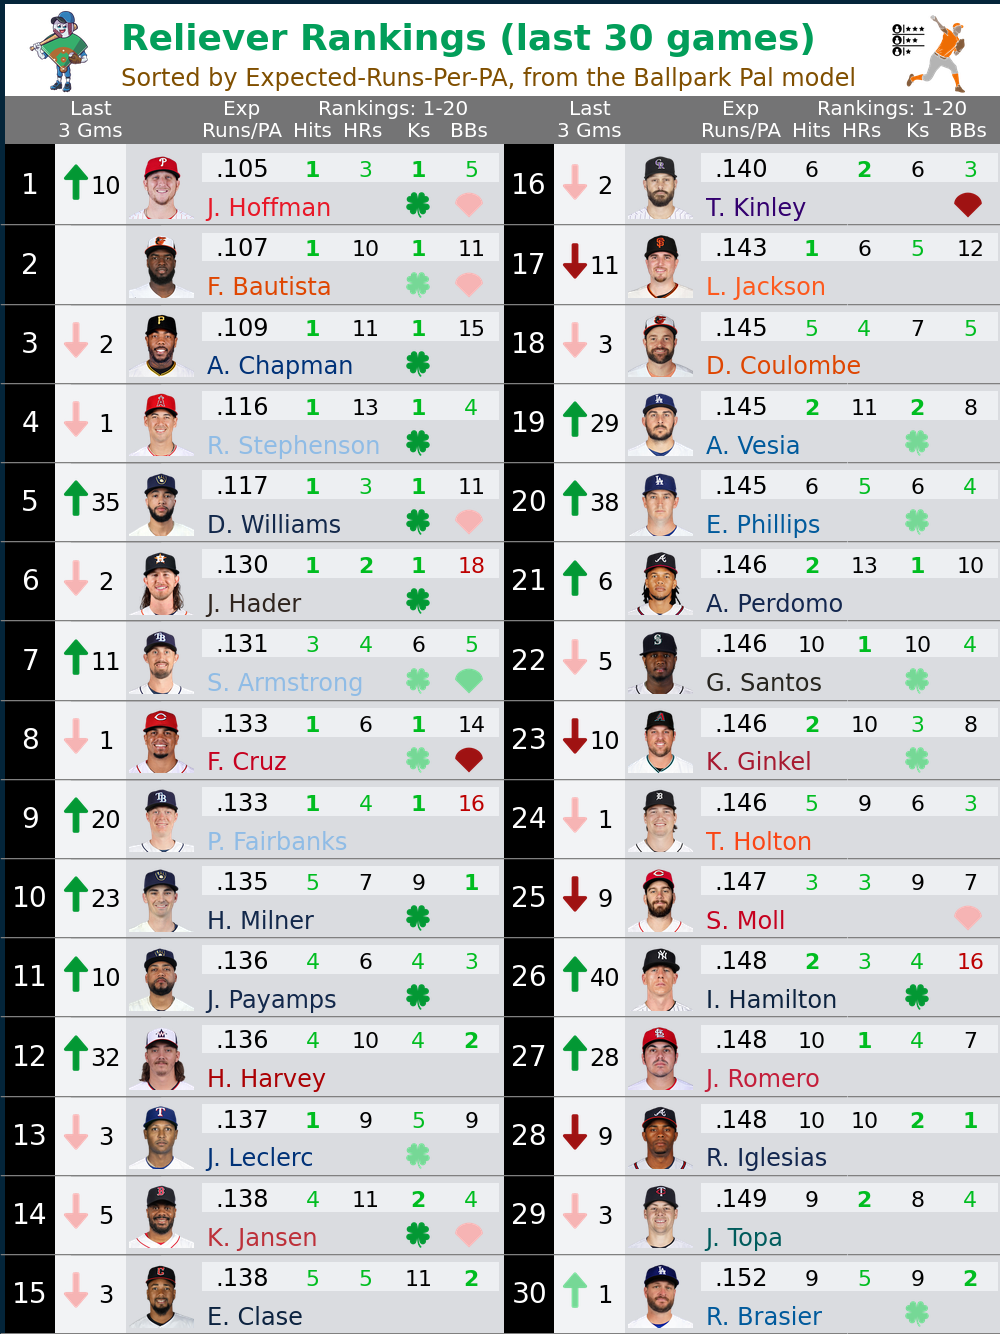
Page 23: Reliever Rankings
This sheet ranks the top 30 relief pitchers in MLB over the past 30 days. The sorting metric is expected-runs-per-plate-appearance as determined by batted-ball expectations. Hits, home runs, strikeouts, and walks are 1-30 rankings from these same models. Luck is the difference expected and actual outcomes, split into batted ball luck and luck related to stadiums/park factors.