

| Runs | HR | 2B/3B | 1B | BB | K |
|---|---|---|---|---|---|
| -5% | +5% | -9% | -7% | -1% | +10% |
| LF | LF | LC | CF | CF | RC | RF | RF | ||
|---|---|---|---|---|---|---|---|---|---|
| Today | 0.99 | 1.00 | 0.89 | 1.03 | 1.19 | 1.05 | 1.01 | 0.99 | |
| Typical | 0.95 | 0.92 | 0.86 | 0.88 | 0.95 | 0.97 | 0.99 | 1.03 |
| LF | LF | LC | CF | CF | RC | RF | RF | ||
|---|---|---|---|---|---|---|---|---|---|
| Today | 0.96 | 0.79 | 0.88 | 0.88 | 0.94 | 0.89 | 0.81 | 0.97 | |
| Typical | 0.89 | 0.75 | 0.88 | 0.85 | 0.82 | 0.81 | 0.81 | 0.95 |
| LF | LF | LC | CF | CF | RC | RF | RF | ||
|---|---|---|---|---|---|---|---|---|---|
| Today | 0.94 | 0.96 | 0.94 | 0.97 | 0.95 | 0.90 | 0.87 | 0.88 | |
| Typical | 0.98 | 0.96 | 0.94 | 0.97 | 0.96 | 0.93 | 0.91 | 0.90 |
 |
 |
|
 |
 |
 |
 |
 |
|---|---|---|---|---|---|---|---|
| 2% | 3% | 11% | 21% | 1% | 10% | 35% | 17% |
| 0 - 3 | 4 - 7 | 8 - 12 | 13 - 20 | 21 + | 27% | 65% | 8% | 0% | 0% |
|---|
| < 50 | 51 - 60 | 61 - 70 | 71 - 80 | 81 - 90 | > 90 |
|---|---|---|---|---|---|
| 3% | 10% | 34% | 31% | 19% | 3% |
| 0 - 20 | 21 - 40 | 41 - 60 | 61 - 80 | 81 - 100 |
|---|---|---|---|---|
| 0% | 26% | 54% | 17% | 4% |
| Value | Rank | ||
|---|---|---|---|
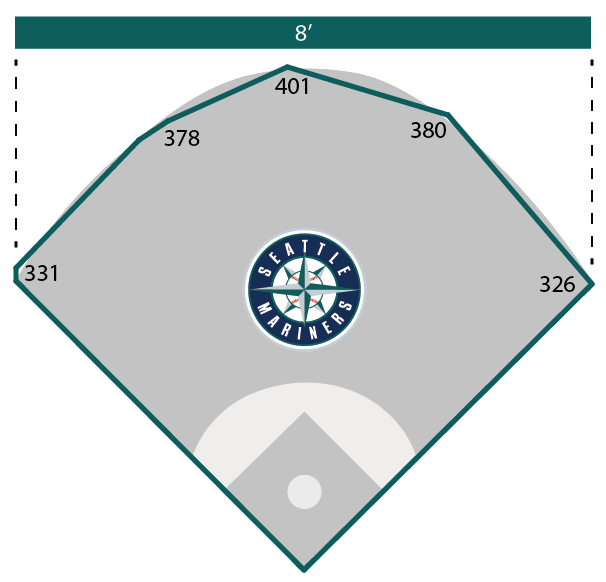
| Runs | -6 % | 26 | |
| Home Runs | +8 % | 7 | Doubles & Triples | -11 % | 28 | Singles | -5 % | 26 | Strikeouts | +2 % | 4 | Walks | -1 % | 27 | Batter Contact | -1.3 % | 28 | Wind Speed | 5.0 mph | 30 | Blowing Out | +1.1 % | 11 | Blowing In | -0.3 % | 27 | Wind Receptiveness | +1.4 % | 22 | Temperature | 72.0° | 21 | Humidity | 50.0% | 25 | Altitude | 10 ft | 29 | Carry | -1.1 % | 29 | Variation | 5.9 % | 15 |
| Totals | Difference | % Dif | Median Dif | |||||
|---|---|---|---|---|---|---|---|---|
| Act | Sim | # | % | Away | Home | Med | Abs | |
| Runs | 553 | 640 | 87 | 16% | 20% | 12% | 0.97 | 2.63 |
| Hits | 1101 | 1214 | 113 | 10% | 12% | 8% | 0.56 | 2.97 |
| 1B | 727 | 777 | 50 | 7% | 10% | 3% | 0.21 | 2.45 |
| 2B/3B | 209 | 244 | 35 | 17% | 13% | 20% | 0.21 | 1.22 |
| HR | 165 | 194 | 29 | 17% | 20% | 15% | 0.51 | 1.35 |
| BB | 560 | 559 | -1 | 0% | 17% | -10% | 1.47 | 2.02 |
| K | 1625 | 1437 | -188 | -12% | -14% | -9% | -1.37 | 2.62 |
| Date | Away | Away SP | Home SP | Runs | Sim | Dif | Hits | Sim | Dif | 1B | Sim | Dif | 2B/3B | Sim | Dif | HR | Sim | Dif | BB | Sim | Dif | Ks | Sim | Dif |
|---|---|---|---|---|---|---|---|---|---|---|---|---|---|---|---|---|---|---|---|---|---|---|---|---|
| 9/18 | NYY | Cortes Jr. | Miller | 3 | 8.70 | 5.70 | 9 | 15.13 | 6.13 | 5 | 9.04 | 4.04 | 3 | 3.18 | 0.18 | 1 | 2.91 | 1.91 | 12 | 7.67 | -4.33 | 29 | 18.08 | -10.92 |
| 9/29 | ATH | Spence | Gilbert | 10 | 7.25 | -2.75 | 16 | 14.66 | -1.34 | 9 | 9.21 | 0.21 | 6 | 3.16 | -2.84 | 1 | 2.29 | 1.29 | 5 | 5.34 | 0.34 | 20 | 18.07 | -1.93 |
| 9/27 | ATH | Sears | Woo | 2 | 8.03 | 6.03 | 9 | 15.24 | 6.24 | 5 | 9.49 | 4.49 | 2 | 3.05 | 1.05 | 2 | 2.71 | 0.71 | 5 | 6.02 | 1.02 | 20 | 15.74 | -4.27 |
| 9/28 | ATH | Estes | Hancock | 12 | 8.59 | -3.41 | 19 | 16.05 | -2.96 | 11 | 9.84 | -1.16 | 3 | 3.21 | 0.21 | 5 | 3.00 | -2.00 | 14 | 5.74 | -8.26 | 19 | 14.06 | -4.95 |
| 9/19 | NYY | Schmidt | Gilbert | 5 | 8.25 | 3.25 | 12 | 15.07 | 3.07 | 10 | 9.71 | -0.29 | 1 | 2.72 | 1.72 | 1 | 2.64 | 1.64 | 12 | 7.22 | -4.78 | 23 | 18.63 | -4.37 |
| 9/17 | NYY | Gil | Woo | 13 | 8.09 | -4.91 | 21 | 14.32 | -6.68 | 11 | 9.05 | -1.95 | 6 | 2.61 | -3.39 | 4 | 2.66 | -1.34 | 9 | 7.79 | -1.21 | 17 | 16.96 | -0.04 |
| 9/15 | TEX | Heaney | Kirby | 7 | 8.13 | 1.13 | 15 | 15.19 | 0.19 | 12 | 9.57 | -2.43 | 1 | 3.14 | 2.14 | 2 | 2.47 | 0.47 | 4 | 6.78 | 2.78 | 12 | 16.26 | 4.26 |
| 9/13 | TEX | deGrom | Hancock | 9 | 8.49 | -0.51 | 17 | 15.57 | -1.43 | 13 | 9.79 | -3.22 | 2 | 2.99 | 0.99 | 2 | 2.80 | 0.80 | 10 | 6.85 | -3.15 | 17 | 18.34 | 1.34 |
| 9/12 | TEX | Rocker | Miller | 9 | 7.81 | -1.19 | 15 | 14.33 | -0.67 | 10 | 9.00 | -1.00 | 1 | 2.87 | 1.87 | 4 | 2.47 | -1.53 | 6 | 7.22 | 1.22 | 23 | 17.45 | -5.55 |
| 9/14 | TEX | Scherzer | Gilbert | 9 | 7.84 | -1.16 | 17 | 14.76 | -2.25 | 9 | 9.24 | 0.24 | 4 | 2.89 | -1.11 | 4 | 2.62 | -1.38 | 8 | 6.62 | -1.38 | 17 | 19.37 | 2.37 |
| 9/10 | SD | Darvish | Kirby | 10 | 7.61 | -2.40 | 21 | 14.99 | -6.01 | 15 | 9.81 | -5.19 | 2 | 2.63 | 0.63 | 4 | 2.55 | -1.46 | 8 | 5.66 | -2.35 | 18 | 15.94 | -2.06 |
| 8/28 | TB | Rasmussen | Castillo | 8 | 7.38 | -0.62 | 15 | 14.31 | -0.69 | 9 | 8.74 | -0.26 | 2 | 3.02 | 1.02 | 4 | 2.55 | -1.45 | 3 | 5.91 | 2.91 | 17 | 20.51 | 3.51 |
| 8/25 | SF | Ray | Woo | 7 | 7.86 | 0.86 | 12 | 14.28 | 2.28 | 10 | 8.70 | -1.30 | 0 | 3.07 | 3.07 | 2 | 2.52 | 0.52 | 11 | 7.40 | -3.60 | 19 | 19.93 | 0.93 |
| 8/27 | TB | Springs | Gilbert | 5 | 6.53 | 1.53 | 13 | 13.59 | 0.59 | 10 | 8.74 | -1.26 | 1 | 2.85 | 1.85 | 2 | 2.00 | 0.00 | 4 | 5.69 | 1.69 | 31 | 20.68 | -10.32 |
| 9/11 | SD | King | Woo | 7 | 7.43 | 0.43 | 9 | 14.39 | 5.39 | 4 | 9.33 | 5.33 | 4 | 2.62 | -1.38 | 1 | 2.44 | 1.44 | 6 | 6.29 | 0.29 | 16 | 16.86 | 0.86 |
| 8/26 | TB | Pepiot | Miller | 6 | 6.80 | 0.80 | 9 | 13.17 | 4.17 | 4 | 8.10 | 4.10 | 2 | 2.71 | 0.71 | 3 | 2.35 | -0.65 | 3 | 6.22 | 3.22 | 21 | 19.97 | -1.03 |
| 8/11 | NYM | Severino | Castillo | 13 | 8.31 | -4.69 | 18 | 15.63 | -2.37 | 9 | 10.02 | 1.02 | 5 | 3.03 | -1.97 | 4 | 2.58 | -1.42 | 13 | 6.78 | -6.22 | 28 | 17.42 | -10.58 |
| 8/23 | SF | Birdsong | Castillo | 10 | 7.71 | -2.29 | 17 | 14.13 | -2.88 | 10 | 9.03 | -0.97 | 3 | 2.61 | -0.39 | 4 | 2.48 | -1.52 | 12 | 8.04 | -3.96 | 32 | 22.25 | -9.75 |
| 8/24 | SF | Snell | Kirby | 7 | 6.62 | -0.38 | 15 | 12.97 | -2.04 | 11 | 8.36 | -2.64 | 3 | 2.26 | -0.74 | 1 | 2.35 | 1.35 | 14 | 6.55 | -7.45 | 17 | 22.41 | 5.41 |
| 8/10 | NYM | Manaea | Gilbert | 4 | 7.20 | 3.20 | 10 | 13.63 | 3.63 | 7 | 8.26 | 1.26 | 3 | 2.97 | -0.04 | 0 | 2.41 | 2.41 | 8 | 6.75 | -1.25 | 19 | 19.74 | 0.74 |
| 8/9 | NYM | Quintana | Miller | 6 | 7.92 | 1.92 | 13 | 14.46 | 1.46 | 9 | 8.97 | -0.03 | 3 | 2.98 | -0.02 | 1 | 2.51 | 1.51 | 7 | 7.57 | 0.57 | 18 | 18.51 | 0.51 |
| 8/6 | DET | Montero | Castillo | 6 | 8.08 | 2.08 | 15 | 15.52 | 0.52 | 12 | 10.08 | -1.92 | 1 | 3.05 | 2.05 | 2 | 2.39 | 0.39 | 5 | 6.76 | 1.76 | 28 | 17.13 | -10.87 |
| 8/4 | PHI | Wheeler | Gilbert | 6 | 7.15 | 1.15 | 13 | 13.90 | 0.90 | 7 | 8.82 | 1.82 | 2 | 2.58 | 0.58 | 4 | 2.51 | -1.50 | 2 | 6.03 | 4.03 | 20 | 19.68 | -0.32 |
| 8/7 | DET | Skubal | Kirby | 8 | 6.50 | -1.50 | 18 | 13.81 | -4.19 | 10 | 8.89 | -1.11 | 5 | 2.91 | -2.09 | 3 | 2.01 | -0.99 | 6 | 5.15 | -0.86 | 20 | 20.17 | 0.17 |
| 8/2 | PHI | Phillips | Woo | 12 | 7.77 | -4.23 | 18 | 15.40 | -2.60 | 11 | 9.96 | -1.04 | 3 | 3.23 | 0.23 | 4 | 2.21 | -1.79 | 7 | 5.97 | -1.03 | 15 | 16.75 | 1.75 |
| 8/3 | PHI | Kerkering | Miller | 11 | 7.64 | -3.36 | 16 | 14.22 | -1.78 | 10 | 8.55 | -1.45 | 5 | 3.25 | -1.75 | 1 | 2.43 | 1.43 | 16 | 6.77 | -9.23 | 24 | 19.14 | -4.86 |
| 8/8 | DET | Hanifee | Woo | 6 | 7.53 | 1.53 | 11 | 14.93 | 3.93 | 7 | 9.71 | 2.71 | 3 | 3.08 | 0.08 | 1 | 2.14 | 1.14 | 4 | 6.07 | 2.07 | 18 | 16.38 | -1.62 |
| 7/23 | LAA | Soriano | Gilbert | 6 | 6.84 | 0.84 | 7 | 14.21 | 7.21 | 6 | 9.35 | 3.35 | 1 | 2.84 | 1.84 | 0 | 2.02 | 2.02 | 9 | 5.76 | -3.24 | 16 | 16.54 | 0.54 |
| 7/19 | HOU | Brown | Castillo | 3 | 8.17 | 5.17 | 10 | 15.83 | 5.83 | 8 | 10.01 | 2.01 | 2 | 3.38 | 1.38 | 0 | 2.44 | 2.44 | 6 | 6.50 | 0.50 | 16 | 17.80 | 1.80 |
| 7/20 | HOU | Valdez | Kirby | 6 | 7.74 | 1.74 | 10 | 15.17 | 5.17 | 6 | 10.05 | 4.05 | 1 | 2.93 | 1.93 | 3 | 2.19 | -0.81 | 9 | 6.49 | -2.51 | 22 | 16.93 | -5.07 |
| 7/21 | HOU | Blanco | Woo | 10 | 7.52 | -2.49 | 18 | 14.71 | -3.30 | 8 | 9.31 | 1.31 | 6 | 3.11 | -2.89 | 4 | 2.28 | -1.72 | 4 | 6.37 | 2.37 | 17 | 15.56 | -1.44 |
| 7/24 | LAA | Canning | Castillo | 2 | 8.53 | 6.53 | 15 | 15.44 | 0.44 | 13 | 9.67 | -3.33 | 1 | 3.15 | 2.15 | 1 | 2.62 | 1.62 | 6 | 7.44 | 1.44 | 21 | 15.75 | -5.26 |
| 7/22 | LAA | Anderson | Miller | 4 | 8.27 | 4.27 | 8 | 14.72 | 6.72 | 7 | 9.03 | 2.03 | 1 | 3.14 | 2.14 | 0 | 2.56 | 2.56 | 8 | 7.84 | -0.16 | 21 | 15.49 | -5.51 |
| 7/7 | TOR | Berrios | Kirby | 9 | 7.42 | -1.58 | 20 | 14.76 | -5.24 | 15 | 9.59 | -5.41 | 2 | 2.81 | 0.81 | 3 | 2.36 | -0.64 | 14 | 5.98 | -8.02 | 25 | 16.02 | -8.98 |
| 7/3 | BAL | Kremer | Gilbert | 5 | 7.63 | 2.63 | 11 | 15.03 | 4.03 | 6 | 9.59 | 3.59 | 3 | 2.92 | -0.08 | 2 | 2.52 | 0.52 | 5 | 5.65 | 0.65 | 21 | 16.67 | -4.33 |
| 7/6 | TOR | Rodriguez | Hancock | 9 | 8.77 | -0.23 | 17 | 16.24 | -0.76 | 12 | 10.80 | -1.20 | 3 | 3.03 | 0.03 | 2 | 2.41 | 0.41 | 9 | 7.67 | -1.33 | 19 | 16.35 | -2.65 |
| 7/4 | BAL | Burnes | Miller | 10 | 7.69 | -2.31 | 17 | 14.83 | -2.18 | 9 | 8.97 | -0.04 | 4 | 3.39 | -0.61 | 4 | 2.47 | -1.53 | 5 | 5.94 | 0.94 | 22 | 16.04 | -5.96 |
| 7/5 | TOR | Gausman | Castillo | 3 | 8.13 | 5.13 | 10 | 15.60 | 5.60 | 7 | 9.84 | 2.84 | 2 | 3.20 | 1.20 | 1 | 2.56 | 1.56 | 7 | 6.35 | -0.65 | 23 | 16.20 | -6.80 |
| 6/28 | MIN | Ober | Gilbert | 5 | 6.49 | 1.49 | 11 | 13.55 | 2.55 | 8 | 8.58 | 0.58 | 2 | 2.76 | 0.76 | 1 | 2.21 | 1.21 | 7 | 5.26 | -1.75 | 17 | 18.64 | 1.64 |
| 6/29 | MIN | Lopez | Miller | 6 | 8.05 | 2.05 | 16 | 14.56 | -1.45 | 10 | 8.62 | -1.38 | 4 | 3.07 | -0.93 | 2 | 2.86 | 0.86 | 3 | 6.60 | 3.60 | 27 | 16.32 | -10.68 |
| 7/2 | BAL | Rodriguez | Kirby | 2 | 7.57 | 5.57 | 11 | 14.94 | 3.94 | 10 | 9.42 | -0.58 | 1 | 3.02 | 2.02 | 0 | 2.50 | 2.50 | 8 | 5.44 | -2.56 | 18 | 17.64 | -0.36 |
| 6/15 | TEX | Eovaldi | Kirby | 12 | 7.70 | -4.31 | 16 | 15.09 | -0.91 | 13 | 10.04 | -2.96 | 1 | 2.77 | 1.77 | 2 | 2.28 | 0.28 | 11 | 6.73 | -4.27 | 21 | 17.69 | -3.31 |
| 6/16 | TEX | Dunning | Gilbert | 4 | 7.98 | 3.98 | 8 | 15.38 | 7.38 | 3 | 9.91 | 6.91 | 4 | 3.20 | -0.80 | 1 | 2.27 | 1.27 | 5 | 7.06 | 2.06 | 21 | 16.73 | -4.28 |
| 6/30 | MIN | Ryan | Castillo | 8 | 7.89 | -0.11 | 17 | 14.99 | -2.01 | 13 | 9.25 | -3.76 | 3 | 3.11 | 0.11 | 1 | 2.64 | 1.64 | 4 | 6.00 | 2.00 | 17 | 16.86 | -0.14 |
| 6/11 | CHW | Thorpe | Diaz | 7 | 7.90 | 0.90 | 15 | 15.77 | 0.77 | 9 | 10.87 | 1.87 | 4 | 2.90 | -1.10 | 2 | 2.00 | 0.00 | 5 | 7.00 | 2.00 | 16 | 17.03 | 1.03 |
| 6/13 | CHW | Crochet | Hancock | 5 | 6.48 | 1.48 | 11 | 13.83 | 2.83 | 6 | 9.18 | 3.18 | 1 | 2.78 | 1.78 | 4 | 1.87 | -2.13 | 6 | 5.97 | -0.03 | 23 | 19.79 | -3.21 |
| 6/12 | CHW | Cannon | Miller | 3 | 6.64 | 3.64 | 9 | 14.10 | 5.10 | 5 | 9.43 | 4.43 | 2 | 2.96 | 0.96 | 2 | 1.71 | -0.29 | 7 | 6.33 | -0.67 | 22 | 17.88 | -4.12 |
| 6/14 | TEX | Heaney | Castillo | 5 | 8.29 | 3.29 | 13 | 15.79 | 2.79 | 9 | 9.66 | 0.66 | 3 | 3.60 | 0.60 | 1 | 2.53 | 1.53 | 6 | 6.36 | 0.36 | 17 | 17.30 | 0.30 |
| 6/10 | CHW | Fedde | Gilbert | 12 | 6.85 | -5.15 | 20 | 14.71 | -5.29 | 13 | 10.04 | -2.97 | 3 | 2.80 | -0.20 | 4 | 1.87 | -2.13 | 8 | 5.64 | -2.36 | 17 | 16.96 | -0.04 |
| 5/30 | HOU | Arrighetti | Gilbert | 4 | 7.16 | 3.16 | 13 | 14.52 | 1.52 | 9 | 9.70 | 0.70 | 2 | 3.18 | 1.18 | 2 | 1.65 | -0.35 | 5 | 7.14 | 2.14 | 17 | 15.30 | -1.70 |
| 5/29 | HOU | Verlander | Kirby | 2 | 7.46 | 5.46 | 11 | 14.44 | 3.44 | 10 | 9.15 | -0.85 | 0 | 3.07 | 3.07 | 1 | 2.22 | 1.22 | 4 | 6.60 | 2.60 | 29 | 14.51 | -14.50 |
| 6/1 | LAA | Detmers | Miller | 9 | 7.38 | -1.62 | 15 | 13.84 | -1.16 | 11 | 8.43 | -2.57 | 2 | 2.90 | 0.90 | 2 | 2.51 | 0.51 | 9 | 6.81 | -2.19 | 18 | 18.78 | 0.78 |
| 6/2 | LAA | Canning | Castillo | 6 | 8.32 | 2.32 | 9 | 15.46 | 6.46 | 5 | 9.80 | 4.80 | 3 | 2.96 | -0.05 | 1 | 2.71 | 1.71 | 11 | 6.62 | -4.38 | 16 | 16.98 | 0.98 |
| 5/31 | LAA | Soriano | Woo | 9 | 7.07 | -1.93 | 16 | 14.23 | -1.77 | 9 | 9.22 | 0.22 | 5 | 2.95 | -2.05 | 2 | 2.07 | 0.07 | 5 | 6.50 | 1.50 | 13 | 16.42 | 3.42 |
| 5/27 | HOU | Valdez | Miller | 5 | 7.92 | 2.92 | 12 | 14.97 | 2.97 | 10 | 9.69 | -0.31 | 2 | 3.00 | 1.00 | 0 | 2.28 | 2.28 | 8 | 7.51 | -0.49 | 14 | 15.79 | 1.79 |
| 5/12 | ATH | Wood | Castillo | 12 | 8.45 | -3.55 | 16 | 15.42 | -0.59 | 9 | 9.58 | 0.58 | 1 | 3.32 | 2.32 | 6 | 2.52 | -3.48 | 5 | 7.32 | 2.32 | 16 | 19.92 | 3.92 |
| 5/13 | KC | Singer | Kirby | 8 | 8.17 | 0.17 | 17 | 15.48 | -1.52 | 12 | 9.80 | -2.20 | 3 | 3.09 | 0.09 | 2 | 2.59 | 0.59 | 3 | 6.18 | 3.18 | 20 | 16.92 | -3.08 |
| 5/14 | KC | Wacha | Gilbert | 6 | 7.70 | 1.70 | 12 | 15.15 | 3.15 | 9 | 9.80 | 0.80 | 0 | 3.06 | 3.06 | 3 | 2.29 | -0.72 | 7 | 6.38 | -0.62 | 21 | 16.58 | -4.42 |
| 5/28 | HOU | Brown | Castillo | 5 | 8.34 | 3.34 | 12 | 15.96 | 3.96 | 8 | 10.47 | 2.47 | 3 | 3.04 | 0.04 | 1 | 2.45 | 1.45 | 4 | 6.84 | 2.84 | 24 | 15.75 | -8.25 |
| 5/15 | KC | Marsh | Woo | 5 | 8.78 | 3.78 | 15 | 15.84 | 0.84 | 11 | 10.04 | -0.96 | 3 | 3.30 | 0.30 | 1 | 2.51 | 1.51 | 3 | 7.65 | 4.65 | 17 | 14.90 | -2.10 |
| 4/30 | ATL | Lopez | Castillo | 5 | 8.44 | 3.44 | 14 | 15.65 | 1.65 | 12 | 10.21 | -1.80 | 1 | 3.09 | 2.09 | 1 | 2.36 | 1.36 | 6 | 8.09 | 2.09 | 21 | 20.48 | -0.53 |
| 5/1 | ATL | Sale | Hancock | 7 | 8.04 | 1.04 | 16 | 15.72 | -0.28 | 13 | 10.43 | -2.57 | 3 | 2.94 | -0.06 | 0 | 2.34 | 2.34 | 8 | 6.62 | -1.38 | 19 | 19.25 | 0.25 |
| 5/11 | ATH | Estes | Miller | 9 | 6.64 | -2.37 | 12 | 12.86 | 0.86 | 6 | 7.92 | 1.92 | 4 | 2.79 | -1.21 | 2 | 2.14 | 0.14 | 6 | 6.78 | 0.78 | 19 | 18.46 | -0.54 |
| 4/29 | ATL | Fried | Miller | 3 | 9.38 | 6.38 | 7 | 16.65 | 9.65 | 5 | 11.32 | 6.32 | 1 | 2.73 | 1.73 | 1 | 2.61 | 1.61 | 4 | 8.59 | 4.59 | 26 | 17.92 | -8.08 |
| 5/10 | ATH | Blackburn | Woo | 9 | 7.25 | -1.75 | 18 | 13.95 | -4.05 | 14 | 9.24 | -4.76 | 3 | 2.71 | -0.29 | 1 | 2.00 | 1.00 | 8 | 7.81 | -0.19 | 20 | 17.06 | -2.94 |
| 4/28 | ARI | Pfaadt | Gilbert | 5 | 7.73 | 2.73 | 11 | 15.55 | 4.55 | 4 | 10.42 | 6.42 | 5 | 2.83 | -2.17 | 2 | 2.30 | 0.30 | 2 | 6.09 | 4.09 | 27 | 17.35 | -9.65 |
| 4/27 | ARI | Cecconi | Kirby | 4 | 8.16 | 4.16 | 7 | 15.85 | 8.85 | 3 | 11.04 | 8.04 | 3 | 2.44 | -0.56 | 1 | 2.37 | 1.37 | 5 | 6.82 | 1.82 | 25 | 15.55 | -9.45 |
| 4/17 | CIN | Abbott | Miller | 6 | 8.27 | 2.27 | 8 | 14.35 | 6.35 | 1 | 9.44 | 8.44 | 3 | 2.94 | -0.06 | 4 | 1.97 | -2.03 | 8 | 9.98 | 1.98 | 21 | 18.62 | -2.38 |
| 4/15 | CIN | Montas | Kirby | 12 | 7.04 | -4.96 | 17 | 13.87 | -3.13 | 5 | 9.58 | 4.58 | 8 | 2.48 | -5.52 | 4 | 1.82 | -2.18 | 6 | 7.96 | 1.96 | 17 | 19.12 | 2.12 |
| 4/26 | ARI | Gallen | Hancock | 7 | 9.83 | 2.83 | 8 | 17.14 | 9.14 | 4 | 11.53 | 7.53 | 0 | 3.00 | 3.00 | 4 | 2.61 | -1.39 | 8 | 9.03 | 1.03 | 13 | 16.40 | 3.40 |
| 4/16 | CIN | Greene | Gilbert | 4 | 6.62 | 2.62 | 12 | 12.50 | 0.50 | 11 | 7.91 | -3.09 | 1 | 2.56 | 1.56 | 0 | 2.04 | 2.04 | 12 | 7.91 | -4.09 | 24 | 21.38 | -2.62 |
| 4/14 | CHC | Assad | Castillo | 5 | 8.85 | 3.85 | 13 | 15.43 | 2.43 | 9 | 9.79 | 0.79 | 2 | 3.30 | 1.30 | 2 | 2.35 | 0.35 | 6 | 9.53 | 3.53 | 22 | 20.37 | -1.63 |
| 4/13 | CHC | Imanaga | Hancock | 5 | 8.22 | 3.22 | 12 | 15.27 | 3.27 | 8 | 10.15 | 2.15 | 1 | 3.06 | 2.06 | 3 | 2.07 | -0.93 | 3 | 8.33 | 5.33 | 16 | 18.72 | 2.72 |
| 4/2 | CLE | Bieber | Castillo | 7 | 9.21 | 2.21 | 21 | 16.58 | -4.42 | 14 | 10.31 | -3.69 | 6 | 3.61 | -2.39 | 1 | 2.66 | 1.66 | 4 | 7.63 | 3.63 | 23 | 18.98 | -4.02 |
| 4/12 | CHC | Wicks | Miller | 6 | 9.14 | 3.14 | 10 | 16.41 | 6.41 | 8 | 11.30 | 3.30 | 1 | 2.86 | 1.86 | 1 | 2.26 | 1.26 | 9 | 9.15 | 0.15 | 18 | 17.70 | -0.30 |
| 4/3 | CLE | Allen | Kirby | 8 | 8.61 | 0.61 | 16 | 15.70 | -0.30 | 11 | 9.86 | -1.14 | 5 | 3.44 | -1.56 | 0 | 2.39 | 2.39 | 6 | 7.25 | 1.25 | 12 | 16.40 | 4.40 |
| 3/29 | BOS | Pivetta | Kirby | 1 | 8.46 | 7.46 | 8 | 15.92 | 7.92 | 7 | 10.11 | 3.11 | 0 | 3.29 | 3.29 | 1 | 2.52 | 1.52 | 5 | 7.08 | 2.08 | 27 | 20.76 | -6.24 |
| 4/1 | CLE | McKenzie | Hancock | 9 | 10.06 | 1.06 | 13 | 16.19 | 3.19 | 10 | 9.95 | -0.05 | 0 | 3.32 | 3.32 | 3 | 2.92 | -0.08 | 9 | 9.29 | 0.29 | 14 | 15.57 | 1.57 |
| 3/30 | BOS | Crawford | Gilbert | 7 | 8.21 | 1.21 | 14 | 15.09 | 1.09 | 12 | 9.11 | -2.89 | 2 | 3.42 | 1.42 | 0 | 2.56 | 2.56 | 6 | 6.97 | 0.97 | 25 | 19.61 | -5.40 |
| 3/31 | BOS | Whitlock | Miller | 6 | 9.57 | 3.57 | 14 | 17.53 | 3.53 | 11 | 11.33 | 0.33 | 1 | 3.66 | 2.66 | 2 | 2.54 | 0.54 | 5 | 7.67 | 2.67 | 18 | 18.23 | 0.23 |
| 3/28 | BOS | Bello | Castillo | 10 | 10.17 | 0.17 | 19 | 17.53 | -1.47 | 10 | 10.74 | 0.74 | 5 | 3.84 | -1.16 | 4 | 2.95 | -1.05 | 4 | 7.93 | 3.93 | 16 | 18.70 | 2.70 |