 matchup for P. Sandoval
 matchup for M. Yoshida
7


Masataka Yoshida has a 34.7% chance of reaching base vs Patrick Sandoval, which is 1.0% higher than Yoshida's typical expectations, and 2.7% higher than batters facing Sandoval.
Masataka Yoshida is worse vs left-handed pitching. Patrick Sandoval is left handed with an over-the-top delivery. Yoshida has an A- grade vs this particular release point.
Patrick Sandoval throws a Changeup 27% of the time. Masataka Yoshida hasn't faced this pitch from left handers very often.
 Pitch Type
 % of Arsenal

 Changeup (L)
 27%
27%

 4-Seam (L)
 26%
26%
 Slider (L)
25%
Slider (L)
25%

 Sinker (L)
12%
Sinker (L)
12%
 Curve (L)
9%
Curve (L)
9%
7.9% of Masataka Yoshida's plate appearances result in a strikeout, which is 11.3% lower than the league average. Patrick Sandoval strikes out 16.6% of the batters he faces, which is 3.4% higher than the typical MLB rate.
19%
 Strikeout
-11.3%
+3.4%
5%
Strikeout
-11.3%
+3.4%
5%
 Walk
-1.9%
0.0%
34%
Walk
-1.9%
0.0%
34%
 In Play
+13.2%
-3.4%
39%
In Play
+13.2%
-3.4%
39%
 On Base
+4.4%
-0.2%
31%
On Base
+4.4%
-0.2%
31%
 Hit
+6.3%
-0.1%
14%
Hit
+6.3%
-0.1%
14%
 Single
+3.1%
+0.4%
13%
Single
+3.1%
+0.4%
13%
 2B / 3B
+3.5%
+0.8%
3%
2B / 3B
+3.5%
+0.8%
3%
 Home Run
-0.3%
-1.4%
Home Run
-0.3%
-1.4%
No History in the last 3 years


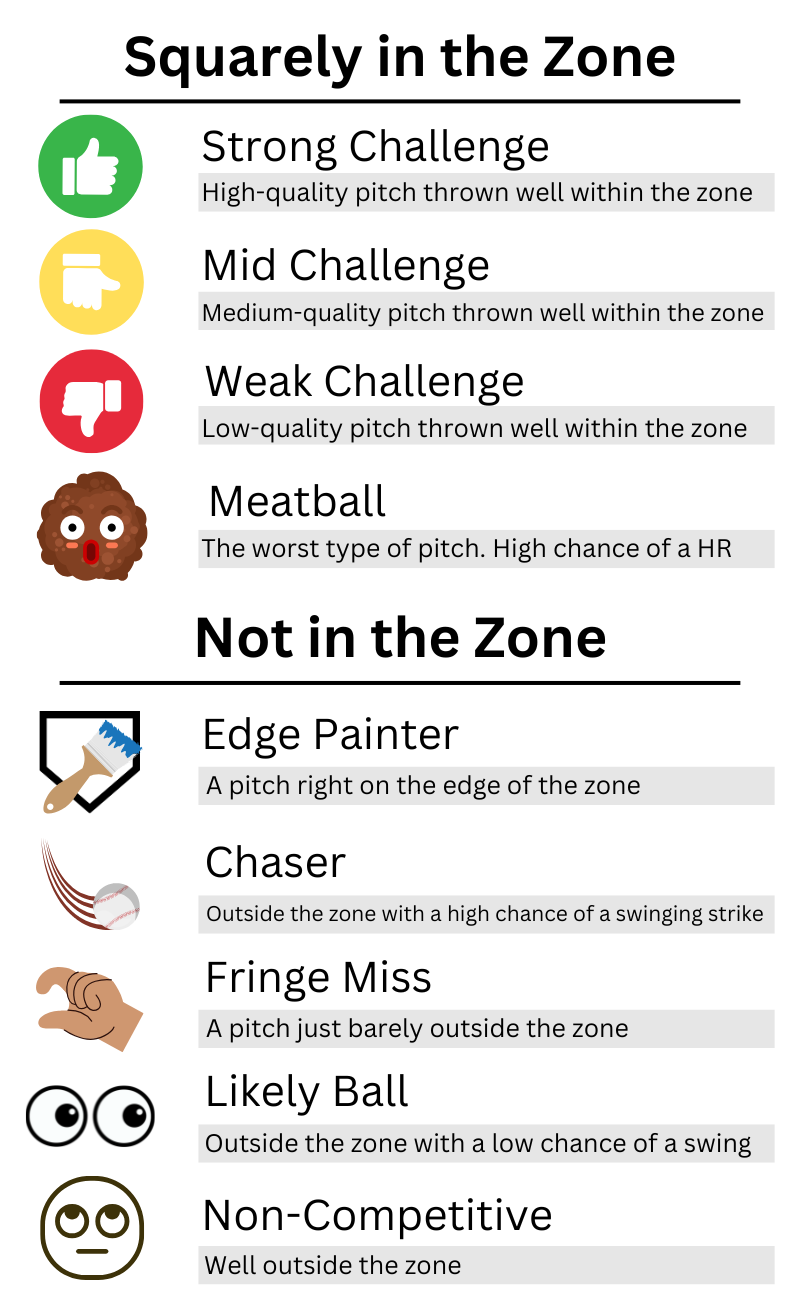

 Weak Challenge

 Edge Painter
 Non-Competitive
 Chaser

 Fringe Miss
 Likely Ball
 Meatball

 Strong Challenge
 Mid Challenge
 Offspeed (L)
 Medium Break
 Slow Velo
 Low Ride
 Squib/Bunt
 Standard Grounder
 Hard Grounder
 Low Screamer
 Rising Liner
 Maybe Homer
 Likely Homer
 No Doubter
 Routine Flyout
 Pop up
 Below 75 mph
 75 to 86 mph
 87 to 93 mph
 94 to 99 mph
 Above 100 mph
 Below -10°
 -10 to 0°
 1 to 6°
 7 to 18°
 19 to 28°
 29 to 38°
 39 to 50°
 Above 50°