 matchup for David Buchanan
6

Gage Workman has a 26.8% chance of reaching base vs David Buchanan, which is 2.4% higher than Workman's typical expectations, and 6.7% lower than batters facing Buchanan.
| Reach | Hit | HR | 2B / 3B | 1B | BB | K | |
|---|---|---|---|---|---|---|---|
| Prediction | 26.8% | 19.1% | 2.2% | 3.8% | 13.1% | 7.7% | 28.4% |
| Workman | +2.4 | +1.3 | +0.1 | +0.3 | +0.9 | +1.1 | -5.8 |
| Buchanan | -6.7 | -4.3 | -0.7 | -2.0 | -1.5 | -2.4 | +7.5 |
David Buchanan throws a Sinker 26% of the time. Gage Workman hasn't faced this pitch from right handers very often
 Pitch Type
 % of Arsenal

 Changeup (R)
26%
Changeup (R)
26%
 Sinker (R)
26%
Sinker (R)
26%
 Curve (R)
12%
Curve (R)
12%
100.0% of Gage Workman's plate appearances result in a strikeout, which is 75.4% higher than the league average. David Buchanan strikes out 6.1% of the batters he faces, which is 16.6% lower than the typical MLB rate.
24%
 Strikeout
+75.4%
-16.6%
8%
Strikeout
+75.4%
-16.6%
8%
 Walk
-8.0%
+6.1%
67%
Walk
-8.0%
+6.1%
67%
 In Play
-67.4%
+10.5%
39%
In Play
-67.4%
+10.5%
39%
 On Base
-39.1%
-0.4%
31%
On Base
-39.1%
-0.4%
31%
 Hit
-31.1%
-6.5%
14%
Hit
-31.1%
-6.5%
14%
 Single
-14.2%
-3.4%
13%
Single
-14.2%
-3.4%
13%
 2B / 3B
-13.8%
-3.0%
3%
2B / 3B
-13.8%
-3.0%
3%
 Home Run
-3.1%
-0.1%
Home Run
-3.1%
-0.1%
No History in the last 3 years
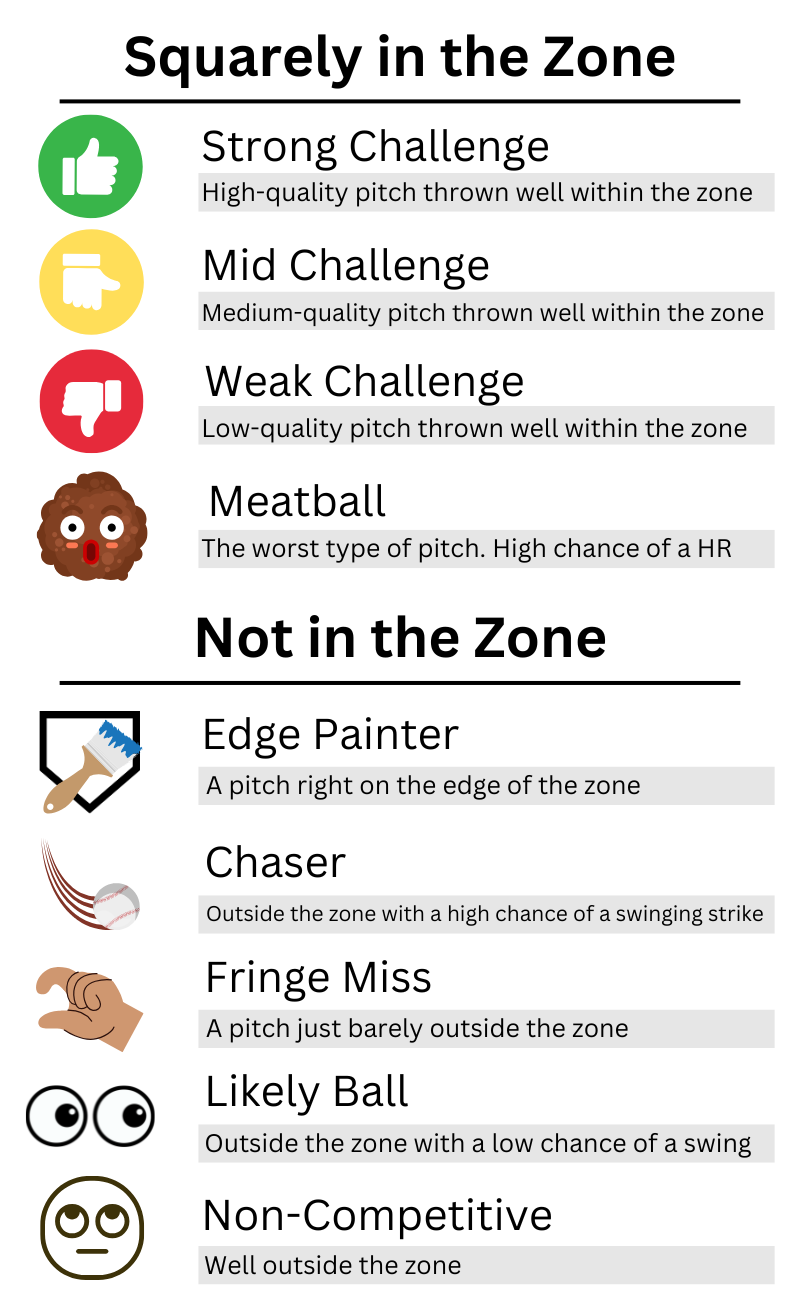
 Non-Competitive
 Fringe Miss
 Mid Challenge
 Likely Ball
 Medium Slow Velo
 Offspeed (R)
 Small Break
 Fastball (R)