matchup for Jordan Lyles
 matchup for Brice Turang
8


Brice Turang has a 35.3% chance of reaching base vs Jordan Lyles, which is 1.4% higher than Turang's typical expectations, and 1.5% higher than batters facing Lyles.
| Reach | Hit | HR | 2B / 3B | 1B | BB | K | |
|---|---|---|---|---|---|---|---|
| Prediction | 35.3% | 26.4% | 1.8% | 6.1% | 18.4% | 8.9% | 12.4% |
| Turang | +1.4 | +0.6 | +0.3 | +0.8 | -0.5 | +0.8 | -4.5 |
| Lyles | +1.5 | +1.9 | -1.5 | +0.2 | +3.3 | -0.4 | -5.3 |
Brice Turang is slightly better vs right-handed pitching. Jordan Lyles is right handed with a horizontal release toward the third base side. Turang has a C grade vs this particular release point.
Jordan Lyles throws a 4-seam fastball 35% of the time. Brice Turang has an F grade against right-handed 4-seamers
 Pitch Type
 % of Arsenal

 4-Seam (R)
 35%
35%

 Slider (R)
 23%
23%
 Curve (R)
17%
Curve (R)
17%

 Sinker (R)
12%
Sinker (R)
12%

 Changeup (R)
10%
Changeup (R)
10%
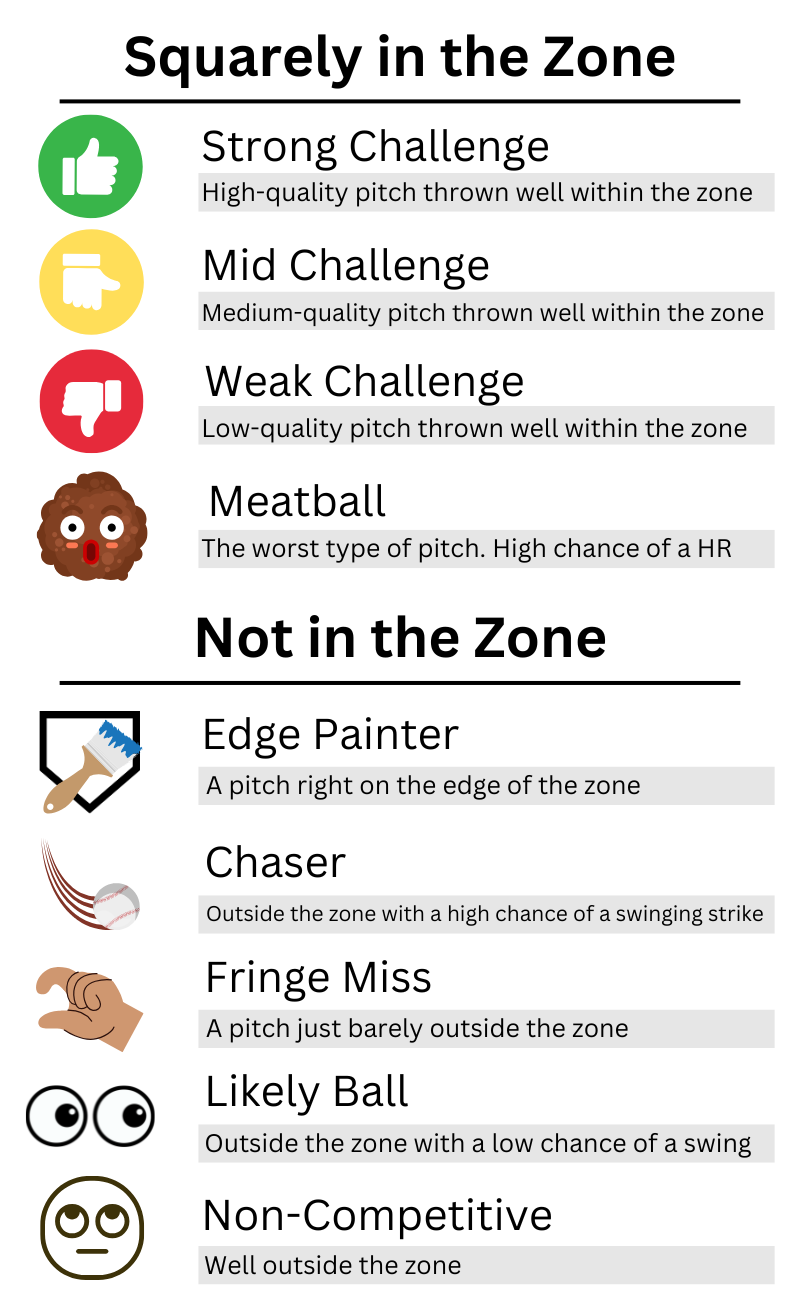
9% of Jordan Lyles's pitches are classified as Meatballs, which is 3% higher than the MLB average. Brice Turang hasn't faced this type of pitch very often.
 Pitch Label
% vs MLB
Pitch Label
% vs MLB

 Meatball
9%
+3%
Meatball
9%
+3%
 Likely Ball
20%
+1%
Likely Ball
20%
+1%
 Fringe Miss
13%
+0%
Fringe Miss
13%
+0%
 Chaser
6%
+0%
Chaser
6%
+0%
 Edge Painter
17%
+0%
Edge Painter
17%
+0%
 Strong Challenge
4%
-1%
Strong Challenge
4%
-1%
 Non-Competitive
12%
-1%
Non-Competitive
12%
-1%
 Mid Challenge
10%
-1%
Mid Challenge
10%
-1%

 Weak Challenge
7%
-1%
Weak Challenge
7%
-1%
16% of Jordan Lyles's pitches are classified as Extreme Drop, which is 12% higher than the MLB average. Brice Turang has a D+ grade against this type of pitch.
Physical Trait
% vs MLB

 Extreme Drop
16%
+12%
Extreme Drop
16%
+12%
 Medium Velo
21%
+10%
Medium Velo
21%
+10%

 Medium Break
28%
+9%
Medium Break
28%
+9%

 Breaking (R)
40%
+9%
Breaking (R)
40%
+9%
10.6% of Brice Turang's plate appearances result in a strikeout, which is 6.8% lower than the league average. Jordan Lyles strikes out 15.7% of the batters he faces, which is 0.8% higher than the typical MLB rate.
17%
 Strikeout
-6.8%
+0.8%
5%
Strikeout
-6.8%
+0.8%
5%
 Walk
-0.6%
-2.3%
37%
Walk
-0.6%
-2.3%
37%
 In Play
+7.4%
+1.5%
39%
In Play
+7.4%
+1.5%
39%
 On Base
+11.3%
-4.1%
31%
On Base
+11.3%
-4.1%
31%
 Hit
+11.9%
-1.8%
14%
Hit
+11.9%
-1.8%
14%
 Single
+6.8%
-1.0%
13%
Single
+6.8%
-1.0%
13%
 2B / 3B
+7.2%
-0.7%
3%
2B / 3B
+7.2%
-0.7%
3%
 Home Run
-2.1%
-0.1%
Home Run
-2.1%
-0.1%
40.9% of Brice Turang's batted balls are classified as Standard Grounders, which is 6.5% higher than the league average. Jordan Lyles induces Standard Grounders at a 26.3% rate, which is 8.1% lower than the typical MLB rate.
0%
 Squib/Bunt
+3.3%
+0.5%
34%
Squib/Bunt
+3.3%
+0.5%
34%
 Standard Grounder
+6.5%
-8.1%
7%
Standard Grounder
+6.5%
-8.1%
7%
 Hard Grounder
-0.3%
+1.3%
14%
Hard Grounder
-0.3%
+1.3%
14%
 Low Screamer
-1.2%
-0.1%
9%
Low Screamer
-1.2%
-0.1%
9%
 Rising Liner
-1.1%
-1.3%
4%
Rising Liner
-1.1%
-1.3%
4%
 Maybe Homer
-2.1%
-0.3%
3%
Maybe Homer
-2.1%
-0.3%
3%
 Likely Homer
-2.2%
+2.6%
1%
Likely Homer
-2.2%
+2.6%
1%
 No Doubter
-1.1%
+0.4%
20%
No Doubter
-1.1%
+0.4%
20%
 Routine Flyout
-2.3%
+1.8%
3%
Routine Flyout
-2.3%
+1.8%
3%
 Pop up
+0.7%
+3.1%
Pop up
+0.7%
+3.1%
13.6% of Brice Turang's batted balls are above 100 mph when they exit the bat, which is 10.7% lower than the league average. 24.9% of batted balls allowed by Jordan Lyles are hit at above 100 mph, which is 0.6% higher than the typical MLB rate.
16%
 Below 75 mph
+7.2%
-2.7%
21%
Below 75 mph
+7.2%
-2.7%
21%
 75 to 86 mph
+0.2%
+1.2%
18%
75 to 86 mph
+0.2%
+1.2%
18%
 87 to 93 mph
+2.2%
0.0%
19%
87 to 93 mph
+2.2%
0.0%
19%
 94 to 99 mph
+1.1%
+0.9%
24%
94 to 99 mph
+1.1%
+0.9%
24%
 Above 100 mph
-10.7%
+0.6%
Above 100 mph
-10.7%
+0.6%
9.3% of Brice Turang's batted balls exit the bat at a launch angle between 29 and 38 degrees, which is 2.1% lower than the league average. 11.3% of batted balls allowed by Jordan Lyles are hit at this angle, which is 0.2% lower than the typical MLB rate.
17%
 Below -10°
+8.9%
-4.2%
12%
Below -10°
+8.9%
-4.2%
12%
 -10 to 0°
0.0%
-1.7%
8%
-10 to 0°
0.0%
-1.7%
8%
 1 to 6°
+0.2%
-0.1%
18%
1 to 6°
+0.2%
-0.1%
18%
 7 to 18°
-0.9%
-2.3%
15%
7 to 18°
-0.9%
-2.3%
15%
 19 to 28°
-2.0%
+1.4%
11%
19 to 28°
-2.0%
+1.4%
11%
 29 to 38°
-2.1%
-0.2%
7%
29 to 38°
-2.1%
-0.2%
7%
 39 to 50°
-3.1%
+0.4%
8%
39 to 50°
-3.1%
+0.4%
8%
 Above 50°
-1.0%
+6.6%
Above 50°
-1.0%
+6.6%
Brice Turang has 1 plate appearance against Jordan Lyles in the last 3 years. He is 0 for 1.
| PA | AB | H | HR | 2/3B | 1B | K | BB | Avg | |
|---|---|---|---|---|---|---|---|---|---|
| Actual | 1 | 1 | 0 | 0 | 0 | 0 | 0 | 0 | 0.000 |
| Expected From Contact → | 0.02 | 0.00 | 0.01 | 0.01 | 0.021 | ||||
| Expected From Contact | |||||
|---|---|---|---|---|---|
| Date | Outcome | HR | 2/3B | 1B | Out |
| 2023-05-14 | Pop Out | 1% | 98% | ||
Expected From Contact: A model predicts the outcome of every ball hit in play based on how it leaves the bat (exit velocity, launch angle, direction, and batter handedness). This helps control for luck, weather, and the park the hitter was in.