matchup for Tim Herrin
 matchup for Brandon Drury
5


Brandon Drury has a 29.1% chance of reaching base vs Tim Herrin, which is 1.8% lower than Drury's typical expectations, and 1.7% lower than batters facing Herrin.
| Reach | Hit | HR | 2B / 3B | 1B | BB | K | |
|---|---|---|---|---|---|---|---|
| Prediction | 29.1% | 20.7% | 1.6% | 4.0% | 15.0% | 8.5% | 27.5% |
| Drury | -1.8 | -3.0 | -0.4 | -0.8 | -1.8 | +1.1 | +3.8 |
| Herrin | -1.7 | +0.8 | -0.6 | -0.2 | +1.6 | -2.5 | +0.3 |
Brandon Drury is better vs left-handed pitching. Tim Herrin is left handed with a horizontal release toward the first base side. Drury has a B- grade vs this particular release point.
Tim Herrin throws a Slider 33% of the time. Brandon Drury has a D- grade against left-handed Sliders
 Pitch Type
 % of Arsenal

 Slider (L)
 33%
33%

 4-Seam (L)
 31%
31%

 Curve (L)
 26%
26%
 Sinker (L)
 10%
10%
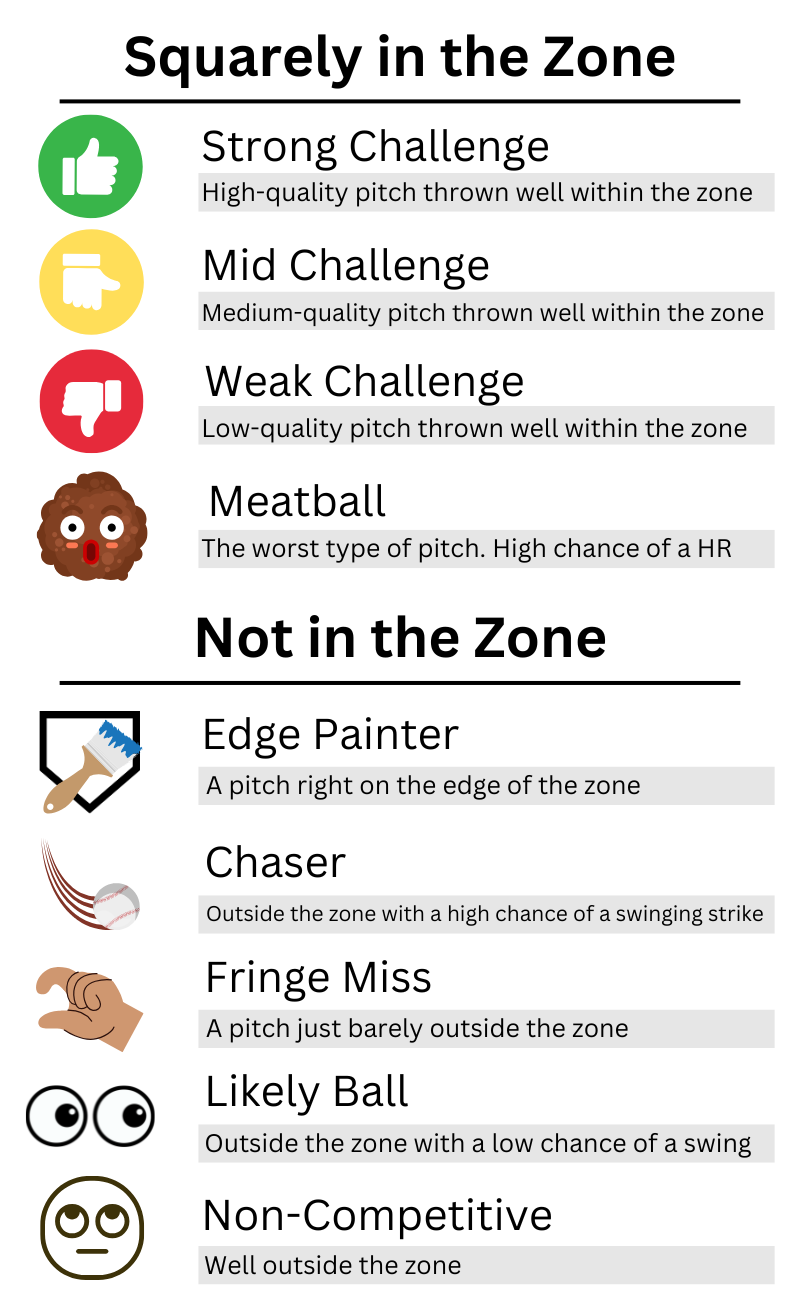
21% of Tim Herrin's pitches are classified as Likely Balls, which is 2% higher than the MLB average. Brandon Drury has a C- grade against this type of pitch.
 Pitch Label
% vs MLB
Pitch Label
% vs MLB

 Likely Ball
21%
+2%
Likely Ball
21%
+2%
 Weak Challenge
11%
+2%
Weak Challenge
11%
+2%

 Chaser
7%
+1%
Chaser
7%
+1%

 Mid Challenge
13%
+1%
Mid Challenge
13%
+1%
 Edge Painter
18%
+1%
Edge Painter
18%
+1%
 Strong Challenge
4%
-1%
Strong Challenge
4%
-1%
 Fringe Miss
11%
-1%
Fringe Miss
11%
-1%

 Non-Competitive
10%
-3%
Non-Competitive
10%
-3%
 Meatball
3%
-3%
Meatball
3%
-3%
59% of Tim Herrin's pitches are classified as Breaking Pitches, which is 29% higher than the MLB average. Brandon Drury has a D grade against this type of pitch from left handers.
Physical Trait
% vs MLB

 Breaking (L)
59%
+29%
Breaking (L)
59%
+29%
 Small Drop
29%
+17%
Small Drop
29%
+17%
 Very Fast Velo
16%
+13%
Very Fast Velo
16%
+13%
 Medium Break
20%
+11%
Medium Break
20%
+11%
14.3% of Brandon Drury's plate appearances result in a strikeout, which is 0.5% lower than the league average. Tim Herrin strikes out 18.1% of the batters he faces, which is 1.8% higher than the typical MLB rate.
14%
 Strikeout
-0.5%
+1.8%
5%
Strikeout
-0.5%
+1.8%
5%
 Walk
-0.9%
+1.9%
39%
Walk
-0.9%
+1.9%
39%
 In Play
+1.4%
-3.7%
39%
In Play
+1.4%
-3.7%
39%
 On Base
-2.2%
-3.4%
31%
On Base
-2.2%
-3.4%
31%
 Hit
-1.4%
-5.3%
14%
Hit
-1.4%
-5.3%
14%
 Single
-0.5%
-2.2%
13%
Single
-0.5%
-2.2%
13%
 2B / 3B
-0.1%
-2.1%
3%
2B / 3B
-0.1%
-2.1%
3%
 Home Run
-0.8%
-1.0%
Home Run
-0.8%
-1.0%
37.4% of Brandon Drury's batted balls are classified as Standard Grounders, which is 2.9% higher than the league average. Tim Herrin induces Standard Grounders at a 44.5% rate, which is 10.1% higher than the typical MLB rate.
0%
 Squib/Bunt
-0.5%
-0.5%
34%
Squib/Bunt
-0.5%
-0.5%
34%
 Standard Grounder
+2.9%
+10.1%
7%
Standard Grounder
+2.9%
+10.1%
7%
 Hard Grounder
-0.7%
-1.9%
14%
Hard Grounder
-0.7%
-1.9%
14%
 Low Screamer
-0.7%
+1.4%
9%
Low Screamer
-0.7%
+1.4%
9%
 Rising Liner
+1.2%
+1.4%
4%
Rising Liner
+1.2%
+1.4%
4%
 Maybe Homer
+0.1%
-0.9%
3%
Maybe Homer
+0.1%
-0.9%
3%
 Likely Homer
+0.7%
-1.0%
1%
Likely Homer
+0.7%
-1.0%
1%
 No Doubter
-0.5%
-0.4%
20%
No Doubter
-0.5%
-0.4%
20%
 Routine Flyout
-1.9%
-8.0%
3%
Routine Flyout
-1.9%
-8.0%
3%
 Pop up
-0.5%
-0.3%
Pop up
-0.5%
-0.3%
26.7% of Brandon Drury's batted balls are above 100 mph when they exit the bat, which is 2.4% higher than the league average. 19.6% of batted balls allowed by Tim Herrin are hit at above 100 mph, which is 4.8% lower than the typical MLB rate.
16%
 Below 75 mph
+3.1%
+6.8%
21%
Below 75 mph
+3.1%
+6.8%
21%
 75 to 86 mph
-0.4%
+1.8%
18%
75 to 86 mph
-0.4%
+1.8%
18%
 87 to 93 mph
-3.8%
-5.2%
19%
87 to 93 mph
-3.8%
-5.2%
19%
 94 to 99 mph
-1.4%
+1.3%
24%
94 to 99 mph
-1.4%
+1.3%
24%
 Above 100 mph
+2.4%
-4.8%
Above 100 mph
+2.4%
-4.8%
9.9% of Brandon Drury's batted balls exit the bat at a launch angle between 29 and 38 degrees, which is 1.6% lower than the league average. 5.8% of batted balls allowed by Tim Herrin are hit at this angle, which is 5.6% lower than the typical MLB rate.
17%
 Below -10°
+1.5%
+6.8%
12%
Below -10°
+1.5%
+6.8%
12%
 -10 to 0°
+1.6%
+1.1%
8%
-10 to 0°
+1.6%
+1.1%
8%
 1 to 6°
-1.6%
+0.8%
18%
1 to 6°
-1.6%
+0.8%
18%
 7 to 18°
+2.2%
+2.2%
15%
7 to 18°
+2.2%
+2.2%
15%
 19 to 28°
-0.2%
-4.3%
11%
19 to 28°
-0.2%
-4.3%
11%
 29 to 38°
-1.6%
-5.6%
7%
29 to 38°
-1.6%
-5.6%
7%
 39 to 50°
+0.1%
+0.3%
8%
39 to 50°
+0.1%
+0.3%
8%
 Above 50°
-1.9%
-1.3%
Above 50°
-1.9%
-1.3%
No History in the last 3 years